
By: Seth Aldrich, Ph.D. FastBridge Learning Affiliate
Effective implementation of a Multi-Tiered System of Supports (MTSS) includes universal screening and progress monitoring for academic and social, emotional and behavioral (SEB) difficulties. FastBridge Learning provides assessments and data management for both. This post will discuss some tips when conducting and interpreting data from the Social Academic and Emotional Behavior Risk Screener (SAEBRS, a universal screener) and Direct Behavior Rating (DBR, a measure used for progress monitoring).
Before considering any assessment, it is essential to consider the questions being addressed. The SAEBRS can effectively and efficiently address the following questions:
- Are programs and practices in our school effective in meeting student needs?
- Is there a high level of need warranting system-wide intervention, or can social, emotional, and behavioral needs of students be addressed through existing supplemental (e.g., Tier 2) resources?
- Are there certain groups whose needs are not being addressed?
- What kind of problems (e.g., externalizing, internalizing, academic enablers) are students experiencing?
- Who are the students we should prioritize for additional supports?
Addressing these questions helps educators prioritize and target supports (e.g., materials, scheduling, and professional development).
The Direct Behavior Rating (DBR) system is a progress monitoring tool for students showing significant risk whose improvement is essential for learning and positive adjustment in school. The DBR addresses the question:
- Is the individual student making progress? (i.e., Do I stay the course or make an instructional/intervention adjustment)?
Social Academic Emotional Behavior Risk Screener (SAEBRS)
Instead of assessing overall SEB risk, the SAEBRS is an effective problem identification and problem analysis tool that helps to better understand student problems falling into the following areas:
- Social (e.g., Arguing, Temper Outbursts, Disruptive Behavior) that might be considered ‘externalizing’ problems.
- Emotional (e.g., Sadness, Anxiety, Withdrawal, Lack of Resilience) that might be associated with ‘internalizing’ problems.
- Academic (e.g., Academic Engagement, Production of Acceptable Work, Preparedness). Academic enables important for learning.
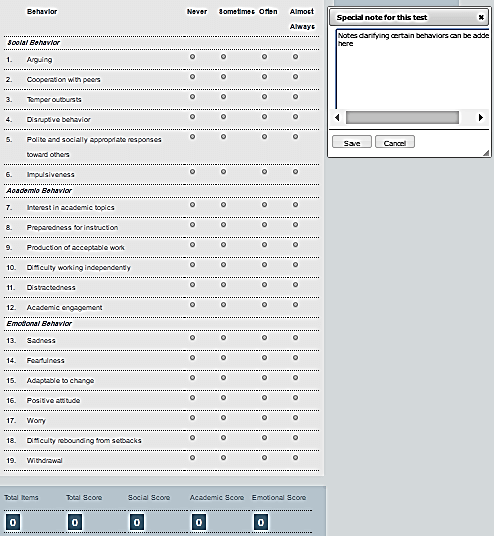
Similar to other academic assessments within FastBridge, teachers access SAEBRS by clicking on an available ‘clock’ and for each student answer 19 items concerning student behavior. It takes 1-3 minutes per student, about 30 - 40 minutes for a class of 20. Teachers can input individual student notes and intervention supports being provided with corresponding dates. Below is an illustration of the teacher interface.
mySAEBRS is a 20 item self-report measure for students in grades 2 – 12 that generally corresponds with SAEBRS items, and like SAEBRS assesses social, emotional and academic risk. mySAEBRS is still in lab form and therefore risk criteria are not yet fully developed.
Interpreting SAEBRS
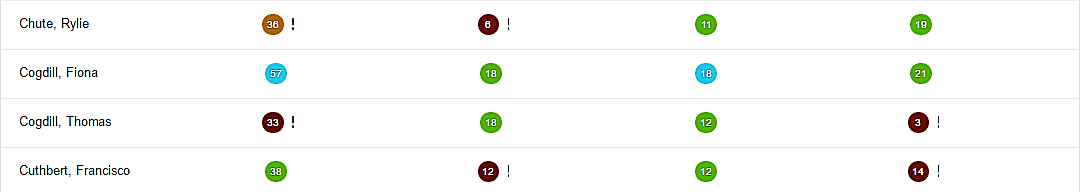
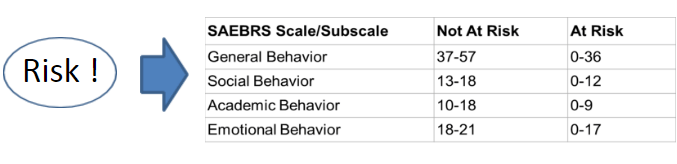
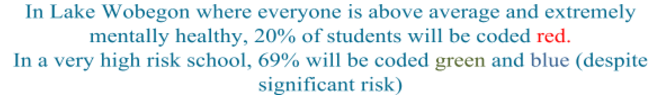
FastBridge reporting provides color coding for grade level local norms, as well as exclamation marks (‘!’) to indicate criterion-referenced risk. Regardless of the number of students at true risk, a local norm will always indicate some students as high, medium, and low risk. Therefore, criterion risk scores (illustrated in the table below) based on correlations between SAEBRS and other social emotional behavioral risk screeners may be the most accurate way of determining true risk.
The following legend shows risk levels by color:

Is indicated based on the following cut scores
Individual student reports
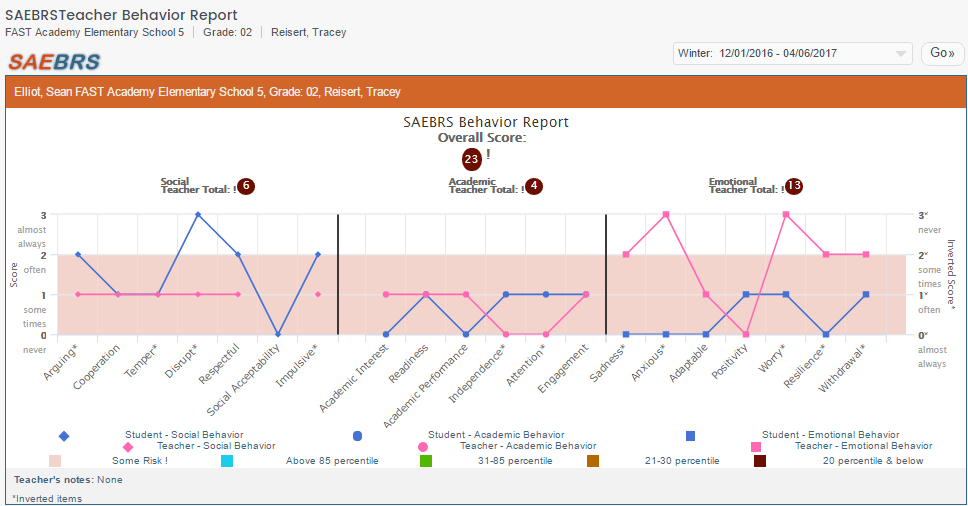
The Individual Student Report provides information at the item as well as the subscale level for SAEBRS and mySAEBRS. To interpret this report, it is important to know that some items are “inverted”, that is, better adjustment is indicated by a ‘3’ for both positively and negatively worded items. The example below illustrates a teacher’s perception of a student’s behavior in comparison to the student self-report. It also illustrates the importance of student self-report for internalizing problems (see the elevated self report for anxiety and worry). Teachers sometimes are not aware that students are experiencing anxiety, worry or sadness. For this reason, important information that can be gleaned from a mySAEBRS self-report measure, especially at higher grade levels.
Information to determine grade level risk as well as decreasing risk over time
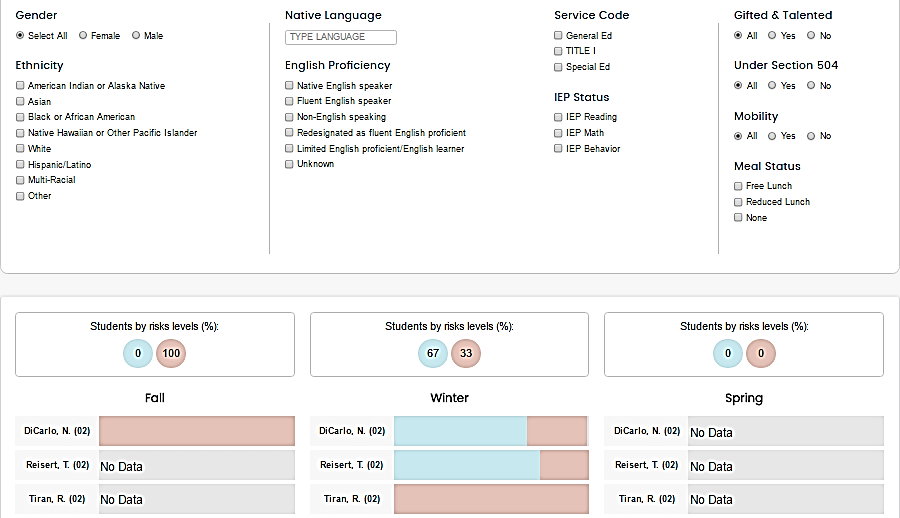
Some schools have many students exhibiting social, emotional and behavioral risks that warrant schoolwide intervention, while other schools may address a smaller number of at-risk students through supplemental tiered supports. The FastBridge Impact Report helps to identify the number of students deemed at risk (based on criterion cut scores). The Impact Report is also helpful in determining whether risk is changing over the school year (effectiveness of Tier 1 and Tier 2 supports). Risk can be further disaggregated through demographic filtering. The report below shows a school that went from 100% of students deemed at risk in the fall to 33% at risk in the winter. In this case we can see that not all students were assessed in the fall (perhaps only at-risk students were assessed) while more students were assessed in the winter (a true universal screening). It is best to use SAEBRS with all students as a true universal screening to avoid such confusion.
Social Emotional Behavioral Progress Monitoring Using Direct Behavior Ratings (DBRs)
The DBR system was developed from an intervention known as the Daily Teacher Behavior Report Cards (TBRC). Despite this origin, it is important to note a difference between the DBR and TDBRCs. TDBRCs are best used as an intervention – We would want teachers to shape behavior with TDBRCs. However, if students aren’t successful they will not likely buy in to their use. Therefore, the kind of behavior that would be deemed ‘successful’ (warranting a sticker, smiley, numeric rating) on a TDBRC might not be the same early in the school year compared to later as student expectations increase. The DBR, on the other hand, is an assessment based on teacher perception of student behavior. These perceptions are important. Although the DBR is subjective (like any rating scale), ratings on a scale of 1 - 10 can be anchored to estimates of frequency such as time on task (e.g., 1=10%, 6 = 60% etc.) for both stability and sensitivity. The DBR also grew from research findings about the high number of systematic direct observations (SDOs) required to get reliable data just for behaviors like time on task. Progress monitoring with SDO by an external observer might not be feasible. The DBR has the advantage of assessing multiple student behaviors deemed important by those working with them.
Establishing Baseline and Setting Goals
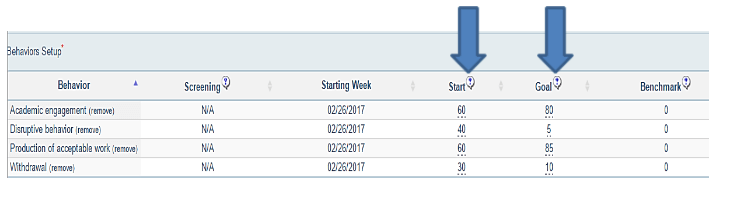
The user interface for DBR progress monitoring within FastBridge is shown below. Baseline (‘Start’) and goal scores are set depending on the type of behavior. In this example, the following goals can be see within the progress monitoring set up illustrated below:
| Student Behaviors | Current | Goal |
| Behaviors to increase | Jeremy is academically engaged 60% of the time | Jeremy will be academically engaged 60% of the time |
| Behaviors to decrease | Jeremy exhibits disruptive behavior 40% of the time | Jeremy will exhibit disruptive behavior 5% of the time |
Entering DBR Data
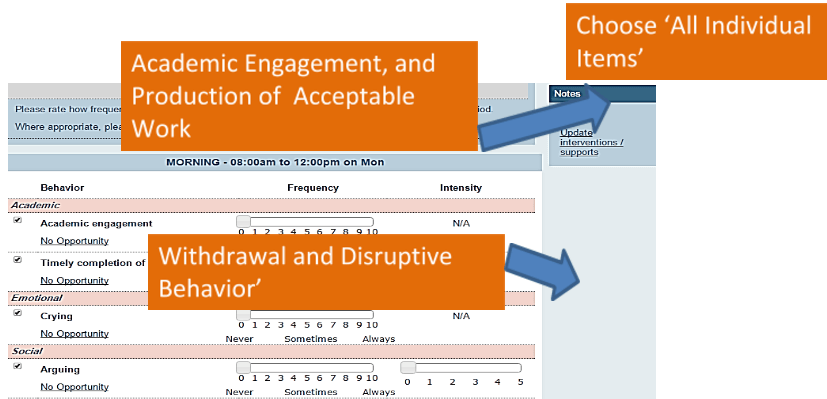
Once the behaviors, start scores, and goals are chosen, teachers can log in at predetermined times of the day or week and rate student behavior on a 1 to 10 scale. Some behaviors include an intensity rating. Notes for a given time period, as well as intervention changes can be documented in the DBR recording page as well. It is advised to choose behaviors that can be rated easily on a 1 – 10 scale such as ‘Timely Completion of Work’. Some behaviors such as ‘Crying’ and ‘Stealing may be difficult to rate on a 1-10 scale.
DBR Progress Monitoring Reports
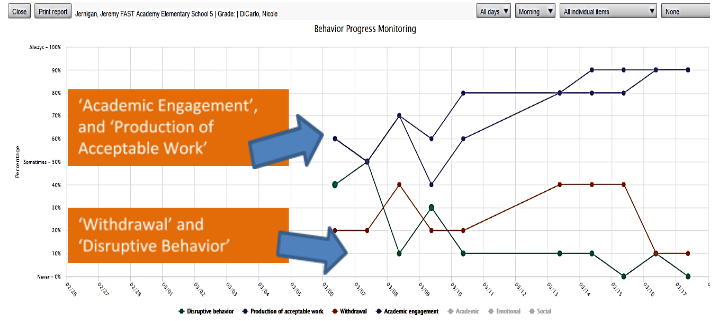
Below is an illustration of a FastBridge DBR progress monitoring report. We can see that over time positive behaviors (in this case, academic engagement and timely completion of work) are improving towards the predetermined goals, while negative behaviors (disruptive behavior and withdrawal) initially rose and then declined with further intervention.
Seth Aldrich is a certified bilingual school psychologist, as well as a NY State licensed psychologist. He works as a school psychologist for the Homer Central School District, and also consults with school districts concerning Response to Intervention (RTI) for academic and behavioral difficulties. Seth consults with educators to utilize FastBridge as well as other RTI/MTSS assessments for data base decision-making within a tiered problem solving process. He is a consortium member with the New York State RTI Technical Assistance Center, and works primarily with English language learners (ELLs) as well as family court involved youth in his private practice. Seth’s most recent publication is the book: RTI for English Language Learners: Understanding, Differentiation and Support.

![[eBook] Get the Whole Picture: Using Social, Emotional and Behavioral Assessments to Support Student Success](https://5196620.fs1.hubspotusercontent-na1.net/hubfs/5196620/AdobeStock_157265506.jpeg)