It’s the first day of school at Sunnyville elementary. In addition to getting to know teachers and classmates, all the children will also have a quick vision and hearing screening by the school nurse. In the coming weeks, they will take screening assessments in reading, math, and social/behavior.
Universal screening is a systematic process typically conducted three times a school year consisting of brief, accurate assessments of critical academic and behavioral skills. Universal screening accomplishes three important tasks for educators to ensure learning is happening at the highest levels for all children:
- Evaluate the effectiveness of all instructional practices;
- Predict which children will meet grade level expectations at the end of the school year; and
- Assess groups of students and identify who mightbe at risk for poor academic or behavioral outcomes requiring support that varies across level, intensity, and duration (Good & Kaminski, 1996; MiBLSi; RtI Action Network).
Evaluating Effectiveness of Universal Instruction
Educators need quick, accurate and reliable ways of knowing if their educational system is meeting the needs of all students within their classrooms. Just as blood pressure or body temperature checks are brief, easy, reliable indicators of overall health, academic and behavioral screenings indicate the overall “health” of a school, class, or individual child. It is not dissimilar to when a school conducts vision and hearing screening at the beginning of the school year.
Universal screening provides data to educators to:
- Evaluate the effectiveness of core instruction;
- Determine what are the critical current instructional needs of students in classrooms right now;
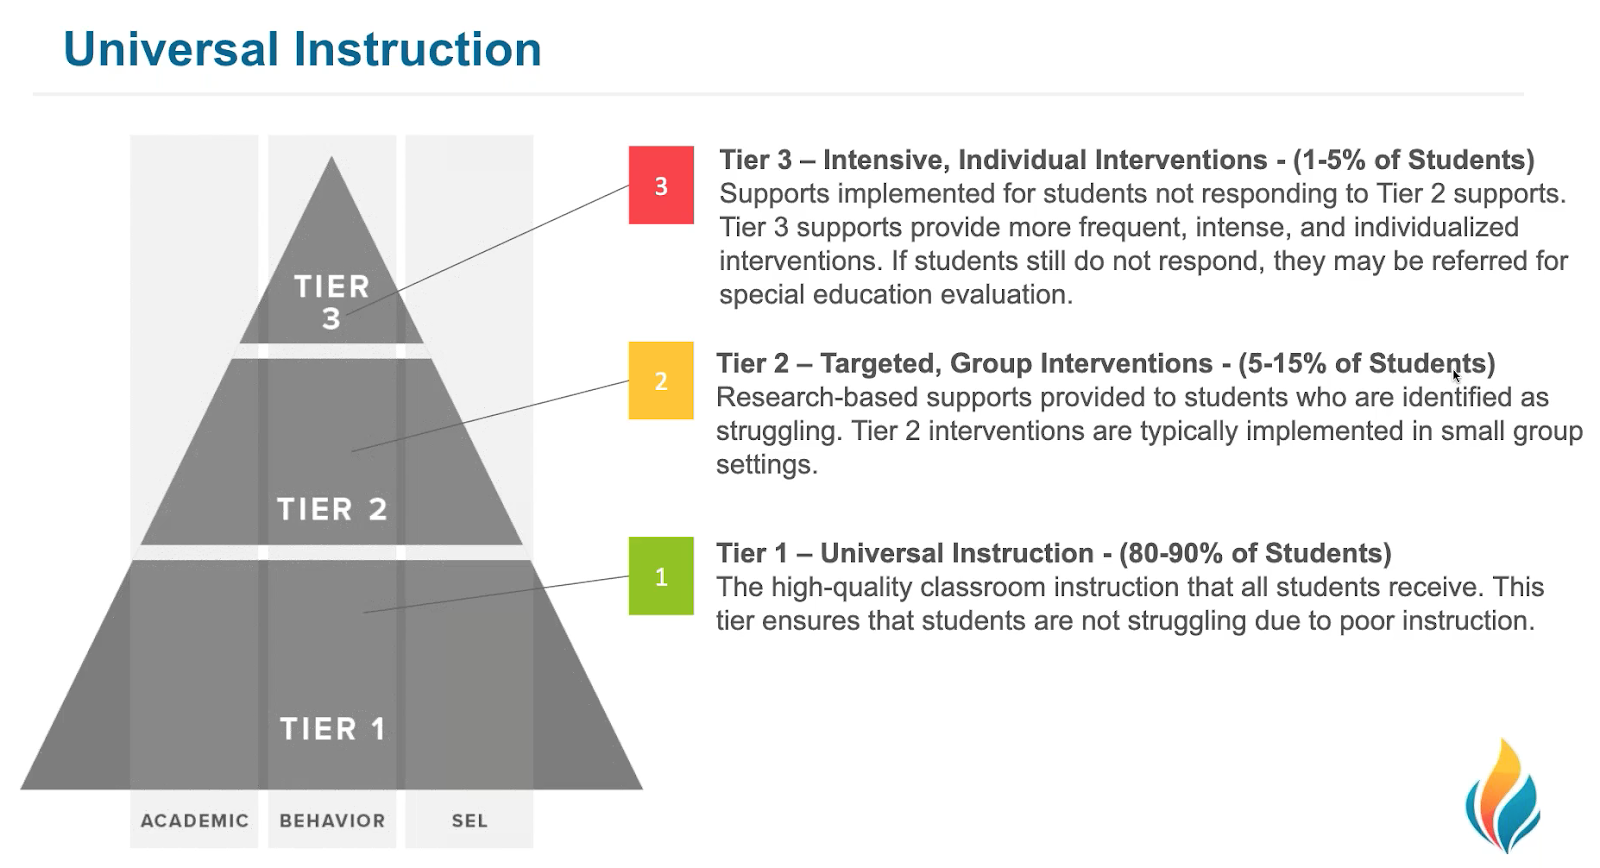
- Determine which students might need additional instruction (i.e., intervention); and, at what level intervention is needed, i.e., Tier 2 (strategic) or Tier 3 (intensive).
Screeners accomplish this by quickly sorting students into "at-risk" and "not at-risk" categories based on how similarly or differently students perform from grade level expectations in the assessed content area. This information can be used to determine how effective instructional practices are overall and also next steps for resource allocation according to the degree of indicated risk.
For example, kids who are extremely discrepant from grade level expectations need an intervention that is more intensive, likely requiring more resources like time or materials, than kids who are less discrepant. An analogy is that if you have a headache, don’t call the neurosurgeon if ibuprofen will fix the problem. But do what it takes to fix the problem.
One guideline is to have approximately 80% of the students reach the grade level criterion, or benchmark, established by the screening tool (RtI Action Network). If the percentage is lower than 80%, educators should intensify their focus on improving Tier 1 instruction. This is because (a) schools do not have the resources to intervene with a large percentage of students, and (b) schools cannot “intervene” their way out of ineffective core instruction (RtI Action Network).
Finally, by design, universal screening measures are brief, repeatable, psychometrically adequate, measure critical skills, have empirically derived cut scores, and are easy to administer and score (VanDerHeyden & Tilly, 2010). It’s common to use a screener with an online data management system to manage, organize, and communicate the data so that it is accessible & usable immediately.
Further, these systems produce reports that visually display screening data results in several formats at the district, school, grade, class, and individual student levels for educators to help evaluate the effectiveness of instruction at all these levels. For example, FastBridge provides immediately available screening data results that are color coded showing at-a-glance the data compared to local norms. Further, FastBridge reports include risk status indicators (e.g., exclamation points) right alongside the data. Used together, these visual tools can be helpful for educators to evaluate the overall effectiveness of instructional practices, and determine effective resource allocation for instruction within their MTSS framework.
Predicting Student Success
In this age of federal mandates for high-stakes assessment and accountability, educators need easily accessed data that will help them predict if all students are on-track to meet grade level expectations. Screeners, then, must have established measurement features that are valid and reliable (Salvia, Ysseldkye, & Bolt, 2013).
Further, educators need “cut-scores” that will indicate increased risk as indicated by a screening assessment. FastBridge provides two types of cut scores: norm-referenced and criterion-referenced. The criterion-referenced scores are those that predict outcomes on high-stakes assessment.
In the FastBridge system, the criterion cut scores are known as benchmarks and there are four levels of performance indicated by these benchmarks:
- High Risk = scores below the 15th percentile
- Some Risk = scores from the 15th - 39th percentiles
- Low Risk = scores from the 40th - 80th percentiles
- College Pathway = scores above the 80th or 85th percentile
The goal of the benchmark indicators is to help educators identify students who are at risk of not meeting grade-level learning goals as early as possible. With screening data in had, teachers can provide additional instruction for students at risk so that they can catch up and remain on grade level.
Identify Students Needing Help
Using cut-scores (e.g., benchmarks), educators can use screeners as a tool for quickly “sorting” students into one of two categories: at-risk or not at–risk for poor achievement or progress in the assessed content area.
Recall the vision and hearing screening that quickly indicates whether the child is meeting a score or range of scores within developmentally appropriate vision and hearing standards or not? Just as with a child who does not “pass” the vision or hearing screen, school teams use screening data and other information sources for those students who are indicated as “at-risk” to determine if more diagnostic data need to be collected, or if a standard treatment protocol (Tier 2) approach is the best place to start. The additional data allow schools to confirm the screening results and the nature and degree of the student's difficulties so that the appropriate amount and type of resources are allocated.
Note that “at-risk” learners include those identified as below the benchmark target for their grade level (e.g., some risk or high risk) and those identified as well-above the benchmark target for their grade level, (e.g., college pathway).
Finally, a further benefit to collecting the screening data is that these can then be used with progress monitoring data to examine the effectiveness of Tier 2 (strategic) and Tier 3 (i.e., intensive) instruction. For example, when a reading problem is identified through screening, teams may be able to sort students into whether the issue is accuracy or rate, and provide intervention targeted at these basic skills as a first step (Hosp, Hosp, Howell, & Allison, 2014). Then a general outcome measure like CBMreading, can be used to progress monitor students weekly. School teams can review these individually graphed data about once a month to determine if students are making adequate growth or not.
Other Considerations for Universal Screening
How often should screening data be collected?
It is recommended to conduct screening three times per year, in the fall, winter, and spring for the following reasons: (a) the demands of the curriculum can increase as the school year progresses, thus winter and spring screenings can catch students who have up to that point been able to make adequate progress; (b) screening benchmarks at various points during the year provide class/school level data that can inform instructional practice and individual decisions; and (c) students might transfer in and out of school and screening at multiple points can ensure that services are not delayed for new students if needed (RtI Action Network).
Who should participate in Universal Screening?
In general, it’s recommended that all students should be included in Universal Screening procedures three times a year in core academic areas (RtI Action Network). However, emerging research suggests that resources are more efficiently allocated, when schools choose to collect screening data for all students only if they are intending to assess the overall effectiveness of school-wide programming (VanDerHeyden (2013). If the purpose of screening is to sort students into those that need intervention and those that do not, then schools could choose to conduct selective screening of those students for whom prior data (i.e., prior screening scores, state test data), are not reliably conclusive.
In general, these are students whose scores are closest to the cut-score for proficiency (Jenkins, Hudson, & Johnson, 2007). Another option is to screen all kids in the fall, and then apply the above practice for winter screening perhaps also including students who are receiving intervention, new students, or students with a specific concern who are referred between fall and winter screening. Then, in the spring, all students could again be screened to have a final data point for planning in the fall. The selective screening approach allows schools to choose the most accurate and useful screening process using the fewest resources.
Implementation of a universal screening process is as valuable at the secondary level as it is at the elementary level, although the specific measures and the process may differ. By middle or high school, students have many years of data that can be used to sort for risk status; these are sometimes referred to as early warning indicators (e.g., report cards, GPA, attendance, core course completion/failure, and behavioral screening). When additional screening is needed, gated screening procedures are efficient. In short, this involves assessing all students on one measure and only testing students in additional areas if they are indicated as at-risk during the first “gate” (MIBLSi; Vaughn & Fletcher, 2012).
Should screening occur for both academics and social/behavior?
Yes. Obtaining screening information on a variety of measures that include academics and social skills behavior can help schools develop and provide more comprehensive and effective interventions by considering the whole child. Learn more about social -emotional and behavior screening here.
Does fidelity matter for universal screening?
Yes; but, more importantly, how is fidelity of universal screening established? Key steps include:
- Ensure the school/district has documented readiness to adopt and support universal screening;
- Ensure thorough and accurate initial training on test administration, scoring, data analysis, and decision making to screening personnel;
- Conduct direct observations of those collecting data using a checklist (e.g., the Observing and Rating Administrator Accuracy (ORAA) in FastBridge
- Ensure easy access to data systems that allow for timely and accurate reporting of results; and
- Provide on-going coaching support (MiBLSi)
References
Aldrich, S. (FastBridge Learning). (2017). Ask the Experts - Screening and Progress Monitoring using FastBridge Social-Emotional Behavior Measures. [Video webinar]. Retrieved from https://fastforteachers.freshdesk.com/support/solutions/articles/5000728590-ask-the-experts-screening-and-progress-monitoring-using-fastbridge-social-emotional-behavior-measure
Ask the Experts (n.d.). RtI Action Network. Retrieved from http://www.rtinetwork.org/connect/askexperts#nogo
Gersten, R., Dimino, J. A., & Haymond, K. (2011). Universal Screening for Students in Mathematics for the Primary Grades: The emerging research base. Understanding RTI in Mathematics. Proven Methods and Applications, 17-34.
Fuchs, D., & Fuchs, L. S. (2006a). Introduction to Response to Intervention: What, Why, and How Valid Is It? Reading Research Quarterly, 41(1), 93–99.
Good, R., & Kaminski, R. (1996). Assessment for Instructional Decisions: Toward a Proactive/Prevention Model of Decision-Making for Early Literacy Skills. School Psychology Quarterly, 11, 326 –336.
Hosp, J. L., Hosp, M. K., Howell, K. W., & Allison, R. (2014). The ABCs of Curriculum-Based Evaluation: A Practical Guide to Effective Decision Making. New York: Guilford Press.
Ikeda, M. J., Neessen, E., & Witt, J. C. (2008). Best Practices in Universal Screening. Best practices in school psychology, 5, 103-114.
National Center on Response to Intervention (n.d.) Retrieved from: http://www.rti4success.org/essential-components-rti/universal-screening.
Salvia, J., Ysseldyke, J. E., & Bolt, S. (2013). Assessment in Special and Inclusive Education (12th ed.). Independence, KY: Cengage Learning.
VanDerHeyden, A. M., & Tilly, W. D. (2010). Keeping RTI on Track: How to Identify, Repair and Prevent Mistakes that Derail Implementation. LRP Publications.
VanDerHeyden, A. M. (2013). Universal screening may not be for everyone: Using a threshold model as a smarter way to determine risk. School Psychology Review, 42, 402-414.
Vaughn, S., & Fletcher, J. M. (2012). Response to Intervention with Secondary School Students with Reading Difficulties. Journal of Learning Disabilities, 45, 244-256.


