By: Holly Windram, Ph.D.
Introduction
In the recent FastBridge Learning blog “Planning for Winter Screening,” the steps for seasonal benchmarking when using the FastBridge Learning application were reviewed and the first three steps - (a) selecting the assessments, (b) arranging a schedule, and (c) making the assessments available for local users – were discussed in detail. In this article, the last two steps- (d) conducting screening, and (e) reviewing data - will complete the winter benchmark process discussion by elaborating on what schools teams should anticipate as they conduct and then review winter benchmark data.
Conducting Screening
Procedurally, much of what happens during winter screening is the same as in the fall in terms of how and when screening will occur. One difference is there may be fewer students if teams have decided that kids who are clearly well-above or clearly well-below grade level do not need to participate in winter screening. When in doubt, though, about any individual or group of students, it’s best to have more data to help inform instruction. Screening data are particularly useful because, by design, they can be gathered quickly, and are reliable and valid.
Further, documenting the fidelity of the winter screening data collection using the FastBridge Observing & Rating Administrator Accuracy (ORAA) tools can assure that fidelity of the screening data are not questioned during the data review that follows. As discussed previously, the making of quality instructional decisions requires ensuring quality data are being used. Why waste the time of students and staff wondering or guessing if the data were collected with fidelity? What if your auto mechanic said, “I work on brakes every few months; so, I’m pretty sure I fixed your brakes and they probably won’t fail.” We would never accept this as reliable enough to drive our vehicles. Often school teams will want to assume fidelity of the data being used for instructional decisions because of self-report or lack of time, but not have documented it through direct observation using a checklist. The process of observation using a checklist is the closest educators can get to having evidence that our data were collected in a reliable and valid manner. Documenting assessment fidelity assures kids are getting the most accurate and valid measure of their learning, so educators can provide the most accurate and valid instruction to meet their learning needs. If educators invest this time to assure the highest level of accuracy from the beginning, they won’t wonder if data are questionable later, thus having to re-assess or take a “good guess” at what instruction is needed.
Reviewing Data
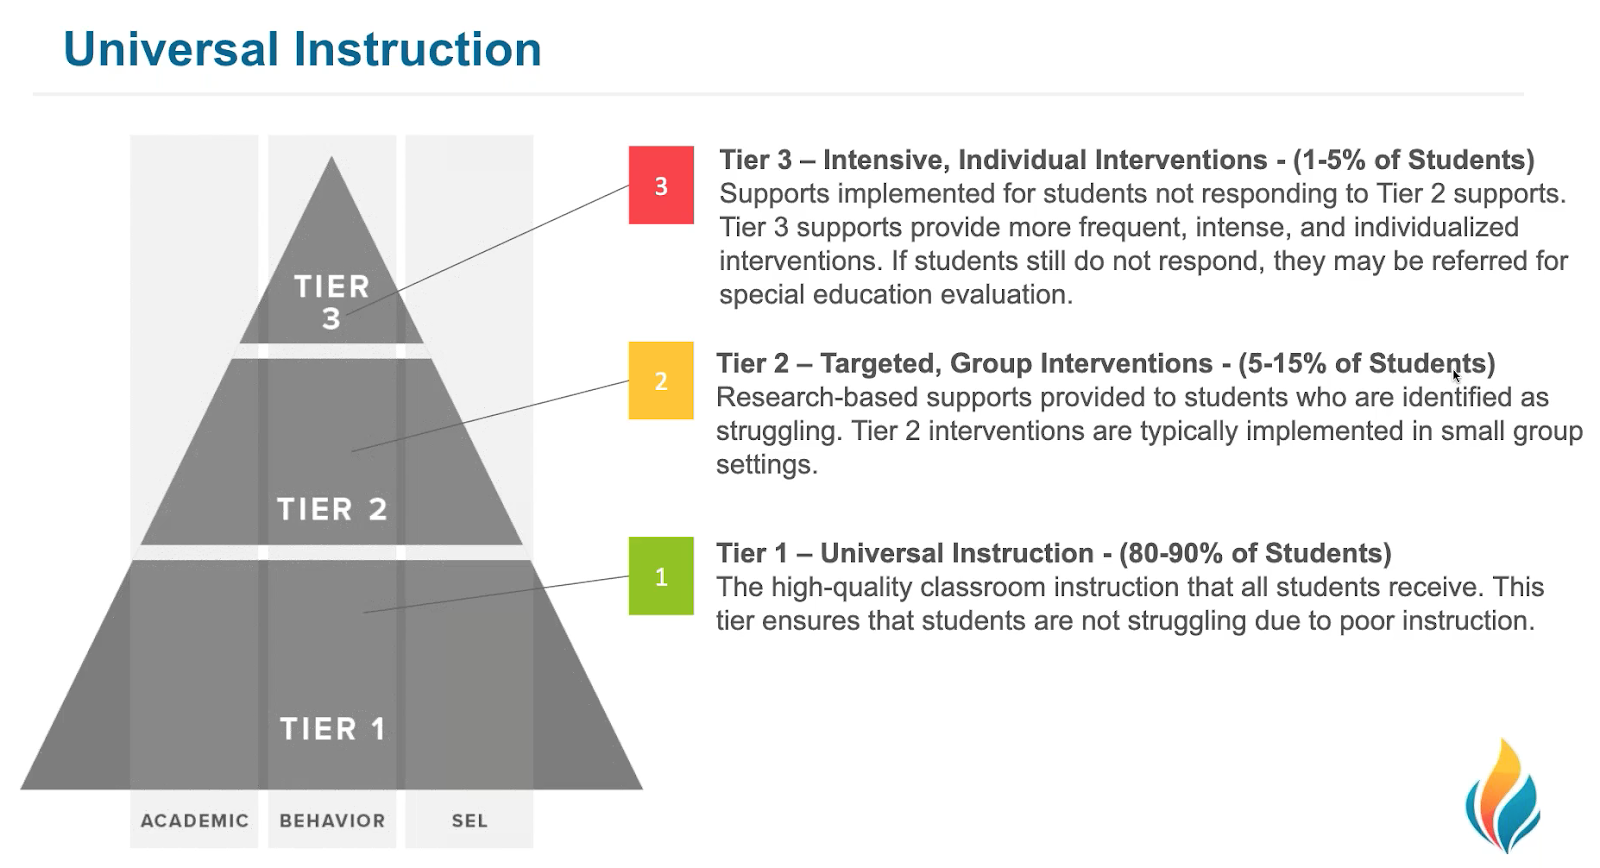
Winter data review meetings can be a fun time for school teams as they get to see the fruits of their labor since school started. With the winter data in hand, teams can apply the problem-solving process to make the same kinds of decisions about student learning needs as they did in the fall. This process starts with data review to identify problem(s) first, then problem analysis, and finally plan development. Below is an overview of the problem-solving model which FastBridge Learning recommends.

A great place to start with the winter benchmark data review is to review the Group Screening Report. Teams will start with the Problem Identification step by asking if there are any discrepancies in what is occurring versus what is expected across grades, schools, or classrooms. The example below shows the first view of group screening data according to norms (see FastBridge Learning Benchmarks and Norms for a review of scores).

These data show there are less students in the lower percentile performance band in the winter than in the fall, and the normative curve of this group is shifting towards more learners being in higher percentiles. This is very positive! Still, the team will also notice that fewer students maintained their status in the highest percentile rank.
The next screen (below) provides further norm data that can assist with interpretation of this first view. A common misinterpretation of norm data is that “green” always means “good.” Here’s why this can be a problem: While there are several students that are in the “green” relative to their local peers, nationally, they may not be very close to their grade level peers. For example, notice Frankeyia -- who is in the 30th-84.99th percentile range compared to the group, school, and district peers -- but nationally falls in the 20th-29.99th percentile range. This is an excellent time for the team to discuss what is working for these groups in terms of core instruction and where core instruction may need to continue to be strengthened so all learners are advancing sufficiently.

In addition to considering student scores in relation to local and national norms, the team will want to consider individual students’ performance towards benchmark goals. The team will know which students are already receiving intervention and can compare screening data with progress monitoring scores for these learners. For example, Frankeyia has advanced her learning towards end-of-year grade level targets from being high risk to being at some risk. Assuming she has been getting an intervention, the team should expect that her progress monitoring data are also showing similar growth towards the spring benchmark target score. Finally, the team can determine which students will need intervention just as teams did with fall screening data. Once the team has had quality discussion around Problem Identification, they will advance to the following questions:
- Who continues to need intervention and for what skill area? This moves into Problem Analysis as teams determine why the problem may be occurring. Then Plan Development occurs as teams determine the progress monitoring goal, the progress monitoring tool, and the intervention plan. There are numerous reports located under “Reporting” in the Analysis & Planning section that provide elaborate individual student data to inform problem analysis.

Further, two very useful FastBridge Learning resources for both Problem Analysis and Plan Development steps are the FastBridge Learning articles Using Data to Group Students and the FastBridge Learning Screening to Intervention Report (s2i). The s2i report is a detailed summary that links multiple sources of screening data to broad instructional needs, what progress monitoring tool to use, and what intervention to consider. There are Screening to Intervention Reports specific to both reading and math.
- Which students who are currently in intervention that should be exited and transitioned from their intervention group? See the FastBridge Learning article Releasing Students from Intervention for how to transition students from their progress monitoring groups.
- Who are the new students who need intervention? Again, teams may have already anticipated students who were already very close to the some risk benchmark target in the fall and are now at or within that target in the winter. Despite quality instruction these students have continued to make growth slower than expected in order to meet end-of-year grade level learning targets, and now need additional, targeted intervention.
- How will new progress monitoring groups be created? The FastBridge Learning article Reorganizing Progress Monitoring Groups provides guidance for teams that is very relevant following the winter benchmark data review. It follows that teams should expect their winter benchmark data review conversations to include planning for how staff time/allocation and instructional resources may need to shift for intervention groups.
Conclusion
Overall, the advent of the winter screening window prompts several important planning steps that start with assessment selection and proceed through reviewing and applying the data to instruction across all tiers. Anticipating the activities and planning for adequate time to attend to the tasks will help make the whole winter screening process all the more effective and efficient.
![[eBook] Get the Whole Picture: Using Social, Emotional and Behavioral Assessments to Support Student Success](https://5196620.fs1.hubspotusercontent-na1.net/hubfs/5196620/AdobeStock_157265506.jpeg)