
By: Seth Aldrich, Ph.D.
There are several ways of setting goals for students when progress monitoring, one of the essential components in a multi-tiered system of supports (MTSS).
The ways in which goals are set should be aligned with the questions they address. For example, if our goal (question) is “Can we get the student to perform targeted foundation skills at a level similar to that of his or her grade mates?” we might set a norm referenced goal for the student to perform at the 30th percentile compared to national or local end of year (spring) norms.
In FastBridge, scores between the 30th and 85th percentile are indicated by green color coding. One problem with norm-referenced goals is that performance at the 30th percentile might not be enough to be successful. Also, some norm-referenced goals, correspond with insufficient long-term growth when we look at norms for rates of improvement (ROIs which will be explained below).
For example, a student performing at the 25th percentile in the fall, who achieves a 30th percentile score (‘average’) by spring, may have made weak growth considering rate of improvement norms and still be considered ‘at risk’ considering criterion targets.
A criterion-referenced goal is one that is set to a specific predetermined level or criterion. Criterion-referenced goals are created by selecting scores that are highly predictive of student success on other assessments. Such goals address the question, “Can we get the student to a proficient level of skills that predict success on other tests (such as a Common Core-aligned state test)?”
In the FastBridge data management system, student attainment of a criterion benchmark is indicated by the term ‘low risk.’ In comparison, students whose scores are below the criterion are coded as being either ‘some risk’ or ‘high risk’. Students at some risk are indicated with one exclamation mark (!) next to the score and those at high risk have two exclamation marks (!!).
Setting these types of goals can answer important questions, but also have potential flaws. A problem for both norm-referenced and criterion-referenced goals is that they may be associated with rates of improvement (growth) that increase gaps in achievement or are so ambitious that they are rarely achieved or sustained.
An example of an overly ambitious criterion-referenced goal might be if we were to expect a second grade student to go from the 10th percentile on CBMreading in the fall (23 words read correctly), to ‘low risk’ in the spring (106 correctly read words).
That student would have to gain 2.3 words per week to achieve that goal (106 goal, minus 23 baseline, divided by 36 instructional weeks from fall to spring, equals 2.3 words per week). When we look at norms for growth rates, this would be well above the 95th percentile, a rate few students ever achieve.
Another alternative is to use rate of improvement (ROI) goals. Educators can set goals in which students “catch up” to their peers, although sometimes over a longer period of time. To achieve a reasonable but ambitious ‘catch up’ goal, a student must improve at a rate stronger than his or her peers.
The analogy might be a cross country runner who is behind the average runners and progressing more slowly, needing to accelerate in order to catch up to the group that is ahead and running faster. Educators must be careful, however, that the goals we set for students are not so ambitious that few students would ever achieve them.
Another way to think about ROI-based goals is to compare them to weight gain or loss. For example, say I needed to lose some weight. At my height, 175 pounds is about my ideal weight (a criterion-referenced goal). If my current weight were 250 pounds and I set a criterion-referenced goal to achieve my healthy weight (175 pounds) over the course of 5 months (20 weeks), I would have to lose 3.75 pounds per week.
This is calculated by subtracting my goal weight from my current weight and dividing that number by how many weeks until my goal date. Weight loss research suggests that losing 1 to 1.5 pounds per week is a healthy, achievable weight loss ‘rate’ within an effective diet and exercise program. In this case, my goal to lose 3.75 pounds per week is overly ambitious as compared to research-based standards.
The unfortunate consequences of this might be that perhaps I had engaged in a very effective weight loss program of diet and exercise and was losing 1.5 pounds per week, but didn’t recognize and appreciate my success because my goal was unrealistic. I might feel failure instead of success and I might change to a less effective weight loss strategy or even attribute my incorrectly perceived lack of success to a metabolic condition.
It would make more sense for me to set a goal to lose 1 to 1.5 pounds per week until I reach my healthy weight. The same types of errors in decision-making can occur when we set overly ambitious goals for students (e.g., we may discontinue an effective intervention or suspect that a child has a learning disability).
Understanding average and realistic ‘catch up’ rates of improvement (ROI) is very helpful in setting reasonable and ambitious goals. For students receiving effective core instruction and additional targeted, evidence-based intervention, the expectation is that they will make stronger than average growth.
A reasonable and ambitious growth rate might be a 75th percentile rate of improvement. That is somewhere between average (50th percentile), and rarely ever achieved (99th percentile). The FastBridge progress monitoring system is designed to ‘default’ to these reasonable but ambitious goals.
For example, for CBMreading the default rate of improvement in the progress monitoring set up menu is 1.5 words per week growth. If students achieve 1.5 words per week in grades 1-3 they will be making growth somewhere near the 75th percentile (see table below).
That is, their rates of improvement would be stronger than the average student in their grade, but the goal rate is not so ambitious that few students would ever achieve it. The careful observer will see that the default goal of 1.5 words per week is sometimes somewhat above or below the 75th percentile. Educators can adjust the growth rate for an individual student based on the actual 75th percentile for that grade/measure or based on the intensity of the intervention provided.
Remember we cannot expect exceptional growth if we are not providing exceptional intervention.
Beyond third grade, a 1.5 word per week goal is at or above the 90th percentile. At these higher grade levels, average rates of improvement tend to decline, in part because many students at the grade level are already reading at a fairly high rate of automaticity and there is an upper limit to how fast a person can and should read. For older students lacking automaticity but getting substantial targeted intervention, more ambitious goals may make sense.
FAST CBMreading ROI at Specific Percentile Ranks
|
Grade Level |
50th Percentile
ROI |
75th Percentile
ROI |
Percentile of growth when
1.5 ROI goal is set |
| 1 | 1.3 | 1.9 | 60th |
| 2 | 1.3 | 1.6 | 65th |
| 3 | 1.1 | 1.4 | 80th |
| 4 | .98 | 1.28 | 90th |
| 5 | .88 | 1.17 | 93rd |
| 6 | .92 | 1.2 | 90th |
An interesting observation of rate of improvement norms is their relative universality. For example, growth norms for AIMSweb (a CBM product similar to FastBridge) are very similar to FastBridge growth norms, despite a different norming population with a different set of graded passages (See table below).
The table below also provides recommendations by Fuchs, Fuchs, Hamlett, Walz and Germann (1993) that were the basis of FastBridge defaults. Although the 1.5 word per week improvement for CBMReading fits with prior research, some default goals in the FastBridge system are set to be far more ambitious.
The table below juxtaposes default ROIs in the FastBridge progress monitoring set up with aggregate ROIs in the FastBridge norms tables. For example, according to FBL norms, in second grade, a 50th percentile ROI for CBMreading is 1.3 words per week growth and a realistic/somewhat ambitious catch up goal (75th percentile growth) would be 1.6 words per week.
AIMSweb norms are very similar at 1.2 (50th percentile growth) and 1.5 (75th percentile growth), respectively. These ROIs are similar to findings by Fuchs et al. in which second graders made on average 1.46 words per week growth. As students progress through grades however, average rates of improvements tend to decline across measures.
Average ROIs for FastBridge and AIMSweb in grade four are .98 and .86 words per week growth respectively. Fourth grade students in the Fuchs et al. study made .84 words per week growth.
Comparison of FAST and AIMSweb ROI at Different Percentile Ranks for Letter Sounds and Nonsense Words
|
Measure and grade level |
FAST ROI by Percentile Ranks | AIMSweb ROI by Percentile Ranks | |||
| 50th | 75th | >95th | 50th | 75th | |
| Letter Sounds | |||||
| K | .96 | 1.26 | 1.66 | .63 | 1.04 |
| 1 | 1.5 | 1.9 | 2.7 | NA | NA |
| Nonsense Words | |||||
| K | .34 words | .55 words | .87 words | .77 sounds | 1.25 sounds |
| 1 | .40 words | .59 words | .87 words | .89 sounds | 1.41 sounds |
*K Nonsense words (FAST and AIMSweb) and K Letter Sounds (AIMSweb) are calculated Winter to Spring. FAST Letter Sounds First Grade are calculated Fall to Winter.
**Nonsense words in FAST are scored by word (with no partial credit). Nonsense words in AIMSweb are scored by sound (with partial credit).
Comparison of FAST, AIMSweb, and Fuchs et al. ROI at Different Percentile Ranks for Oral Reading Fluency
|
Grade Level |
FAST ROI by Percentile Ranks | AIMSweb ROI by Percentile Ranks* | Fuchs et al. ROI | ||
| 50th | 75th | 50th | 75th | Average | |
| 1 | 1.3** | 1.9** | 1.58** | 2.14** | 2.1** |
| 2 | 1.3 | 1.6 | 1.21 | 1.51 | 1.46 |
| 3 | 1.1 | 1.4 | 1.09 | 1.40 | 1.08 |
| 4 | .98 | 1.3 | .86 | 1.17 | .84 |
| 5 | .88 | 1.17 | .89 | 1.18 | .49 |
| 6 | .92 | 1.2 | .72 | .99 | .32 |
| 7 | NA | NA | .67 | .92 | NA |
| 8 | NA | NA | .53 | .76 | NA |
*AIMSweb growth rates presented in the table are for students performing in the average range (between the 25th and 75th percentile on the fall benchmark).
**All grade 1 ROI calculations are based on winter to spring norms because such data are not collected uniformly in the fall of first grade.
Other Considerations When Setting Goals
One advantage of rate of improvement goals is that at any given time a student’s current growth can be compared to the ROI goal. When we set norm-referenced or criterion-referenced goals, we typically identify a number at the end of the progress monitoring schedule (e.g. in the spring).
The goal only makes sense on that date. We have to look at the current rate of improvement anyway, to see if the student is on a trajectory to meet that goal.
The FastBridge norms tables provide percentile rankings for rates of growth based on the national aggregate sample of scores. Simply go to the norms tables (CBMreading for 2nd grade in this example), find the measure, grade level and identify aggregate growth that corresponds with the 75th percentile (1.63 in the example below).
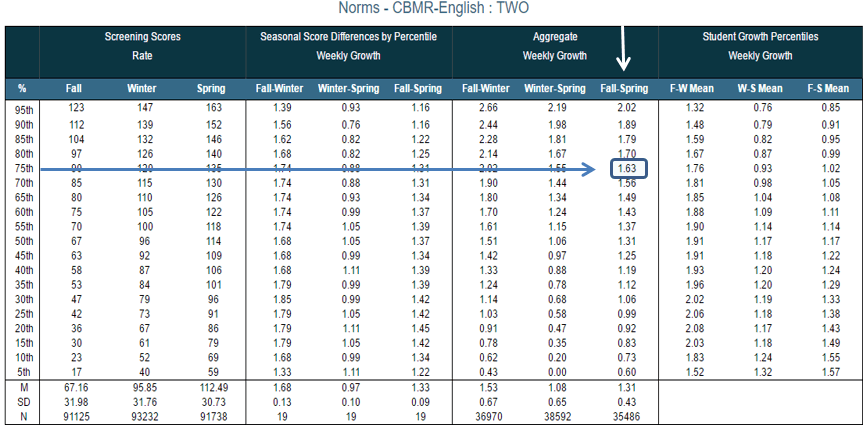
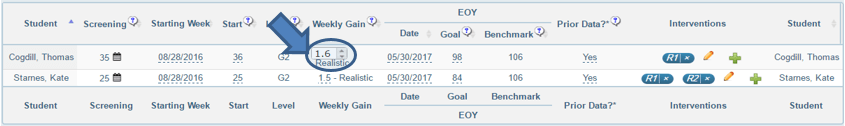
Educators using the FastBridge progress monitoring system can adjust default goals (e.g., 1.5 words per week growth for CBMReading) to correspond with 75th percentile rates of improvement for a given measure and grade level for a more precise, reasonable and ambitious goal.
When the weekly gain is adjusted, the corresponding end of year ‘Goal’ is also adjusted and can be compared to the ‘Benchmark’ score that indicates a low risk status.
With the advent of rate of improvement or ‘growth’ norms, educators are able to set realistic and ambitious goals based on the progress monitoring measures they are using at a particular grade. When students achieve a 75th percentile rate of improvement relative to average students at that grade, they will usually catch up. Maybe not this year, but eventually.
Rates of improvement norms provide data that may help prevent educators from setting inadequate goals that increase gaps in achievement, or overly ambitious goals that lead to bad decision-making.
References
AIMSweb ROI Growth Norms (2017, January 11). Retrieved from
https://www.fastbridge.org/wp-content/uploads/2017/01/ROI_Norm_Tables1.pdf
Fuchs,L.S., Fuchs, D., Hamlett, C. L., Walz, L. & Germann, G. (1993). Formative Evaluation of Academic Progress: How Much Growth Can We Expect? School Psychology Review, 22, pp. 27 – 48.
Seth Aldrich is a certified bilingual school psychologist, as well as a NY State licensed psychologist. He works as a school psychologist for the Homer Central School District, and also consults with school districts concerning Response to Intervention (RTI) for academic and behavioral difficulties. Seth consults with educators to utilize FastBridge as well as other RTI/MTSS assessments for data base decision-making within a tiered problem solving process. He is a consortium member with the New York State RTI Technical Assistance Center, and works primarily with English language learners (ELLs) as well as family court involved youth in his private practice. Seth’s most recent publication is the book: RTI for English Language Learners: Understanding, Differentiation and Support.


![[eBook] Get the Whole Picture: Using Social, Emotional and Behavioral Assessments to Support Student Success](https://5196620.fs1.hubspotusercontent-na1.net/hubfs/5196620/AdobeStock_157265506.jpeg)