As January comes to a close most schools have completed winter screening, which means the data are ready to interpret. But what makes the interpretation of winter screening scores so crucial?
In this post we will review factors to consider about winter screening data, including:
- (a) the percentages of students at high risk, some risk, low risk, and those exceeding expectations,
- (b) how much growth all students have made, and
- (c) which students might need revised or additional intervention
Plus, we will highlight how midyear data provides teaching teams the opportunity to modifications to the overall system of support before the school year ends.
Understanding Risk Levels
FastBridge screening reports provide information about all students’ performance in relation to year-end learning goals. There are four performance levels included in these reports:
- High Risk
- Some Risk
- Low Risk
- College Pathway (aMath, aReading, CBMreading only)
These indicators are designed to help teachers identify which students need additional help. The word “risk” is used as a way to denote students whose current scores suggest that they might not meet year-end learning goals.
In the FastBridge system, student risk levels are indicated by exclamation marks. Those students whose scores are at high or some risk of not meeting the end of year goals have one or two exclamation marks. Those students likely to meet the goal do not have an exclamation mark. Those students with scores likely to exceed the learning standards have stars next to the scores.
High Risk
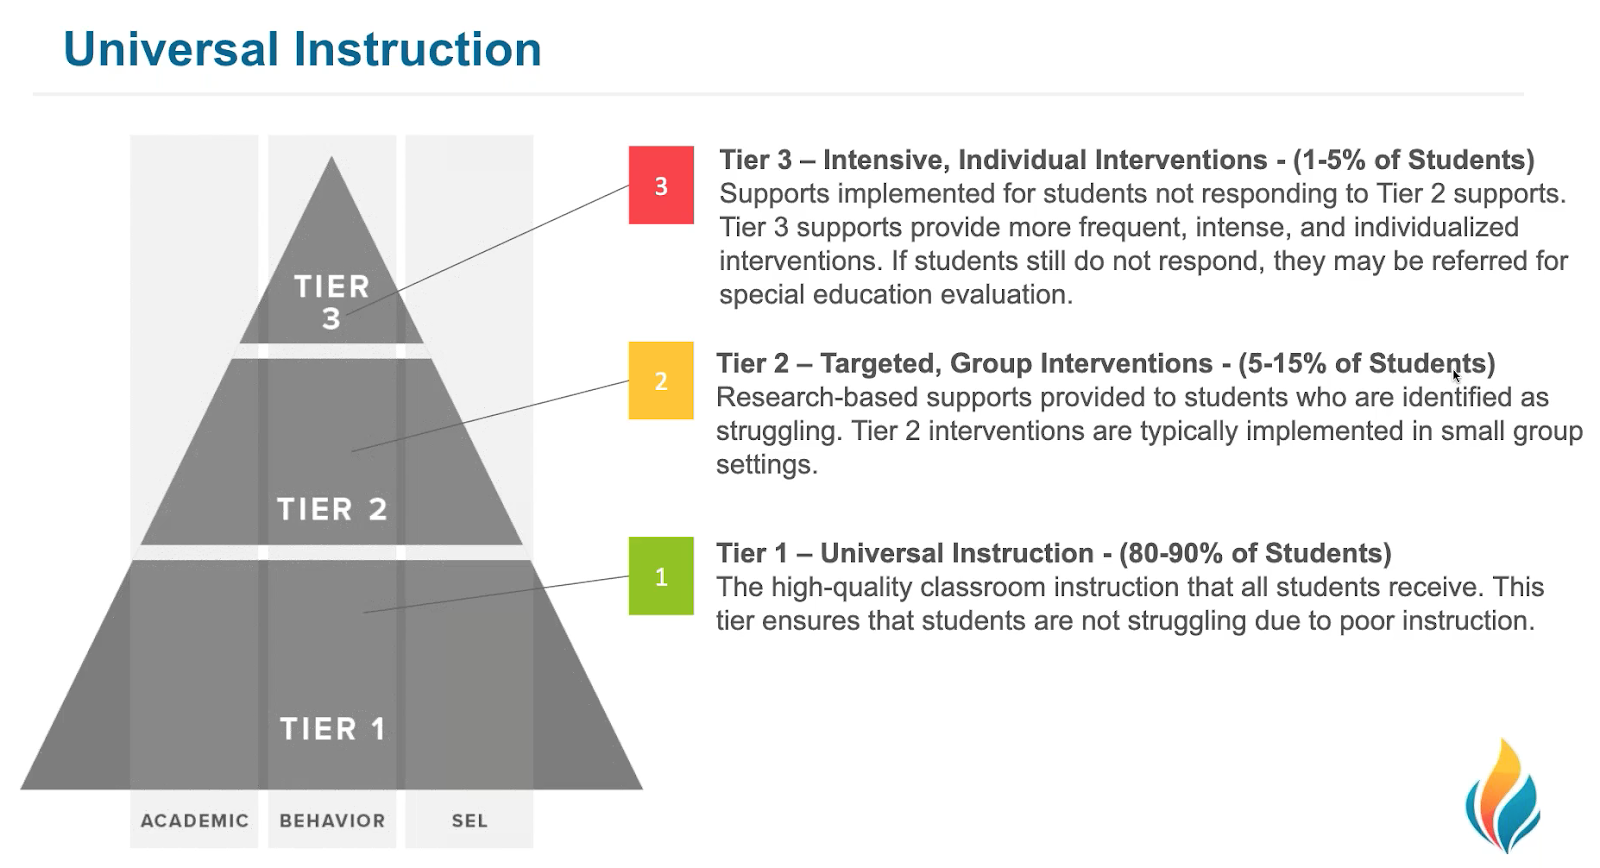
Students noted to be high risk are those whose winter screening scores suggest that they are very unlikely to reach the year-end learning goals. In the FastBridge system, high risk scores are those falling below the 15th percentile as compared to national norms. High risk scores are indicated with two exclamation marks (!!). Research suggests that students whose scores indicate high risk require intensive intervention in order to meet learning goals.
Some Risk
Some students’ winter screening scores will indicate below level performance that is closer to the grade level goal. The FastBridge system considers scores between the 15th and 40th percentiles to indicate some risk by displaying one exclamation mark (!). Students with scores in this range are likely to benefit from less intensive targeted instruction.
Low Risk
Students whose scores show that they are on a path to meet the grade level learning goals are considered to be at low risk of learning problems. These are students who have demonstrated success with the Tier 1 core curriculum and should continue with the same instruction.
College Pathway
Some students will have winter screening scores that are well above the benchmark goals. Those students’ whose scores fall substantially above other students can be coded in FastBridge reports according to district-defined terms. FAST™ assessments will indicate which students have scores that exceed grade-level standards by showing a star next to the score and applying the term College Pathway. The label for scores above grade level expectations can be adjusted by FastBridge users. The district manager can apply a district-specific term for students whose performance exceeds expectations.
Measuring Student Growth
Another way to understand students’ winter scores is in relation to their growth. Growth data indicate how much change students have made from fall to winter. Growth is important because the amount of growth over time will determine if a student stays at the same level or moves ahead.
Schools aim to provide all students with at least one year’s growth during each academic year. For students whose scores indicate that they need to catch up to grade level goals, more growth is needed.
FastBridge provides the Group Growth report so that teams can examine how much learning growth all students have experienced. The Group Growth report shows both weekly and monthly growth scores as well as the percentile ranks for growth scores. Having data about student growth in the middle of the school year is important because it allows educators to adjust instruction for students needing faster growth.
Updating Interventions
After reviewing winter screening data, school teams will be able to update interventions in relation to students’ needs. At the end of the day it is interventions (e.g., instruction) that change student learning outcomes.
Data from progress monitoring are important because they provide information about which interventions actually work. Those interventions with data indicating strong positive effects should be maintained. Those interventions with limited to no effects should be discontinued.
When selecting new intensive interventions, key principles are that the instruction include direct and systematic procedures as well as reflect each student’s learning goals.
When students display limited score gains from an intervention, consider changing to a different intervention. Winter screening scores can assist teams in determining which students need different intervention by revealing the students’ scores on grade-level material. The screening scores should be reviewed alongside progress data so teams can understand how close the student is to the grade level goal. This is especially important for students whose progress is monitored below grade level.
Conclusion
Winter screening data provides teachers with an important snapshot of all students’ performance. It can be reviewed in relation to the percentages of students at different risk levels, the amount of growth, and the need to intensify intervention for some students.
Having universal data halfway through the year gives teams the opportunity to learn how well the overall system of supports is working and what should be changed in order to improve outcomes for all students by the end of the school year.
Want to learn more about the Formative Assessment for Teachers™ (FAST)? Contact us to schedule a demo.


![[eBook] Get the Whole Picture: Using Social, Emotional and Behavioral Assessments to Support Student Success](https://5196620.fs1.hubspotusercontent-na1.net/hubfs/5196620/AdobeStock_157265506.jpeg)


