By: Rachel Brown, Ph.D., NCSP
In order for teachers to know how their students are doing, they must be able to review student performance data over time. Although there are many types of assessments used in schools, certain ones are better for evaluating student learning growth. In particular, universal screening scores and progress monitoring data are designed to help teachers know how much learning growth students are making. Such growth is important because it is how students progress from one skill level to the next. Students who start a school year on grade level will stay on level if they make at least one year’s growth in a school year. But, students who start out below grade level need to make accelerated growth in order to catch up to peers.
Individual Student Growth
The type of assessment most often used to measure individual student growth is a progress monitoring graph (see below).
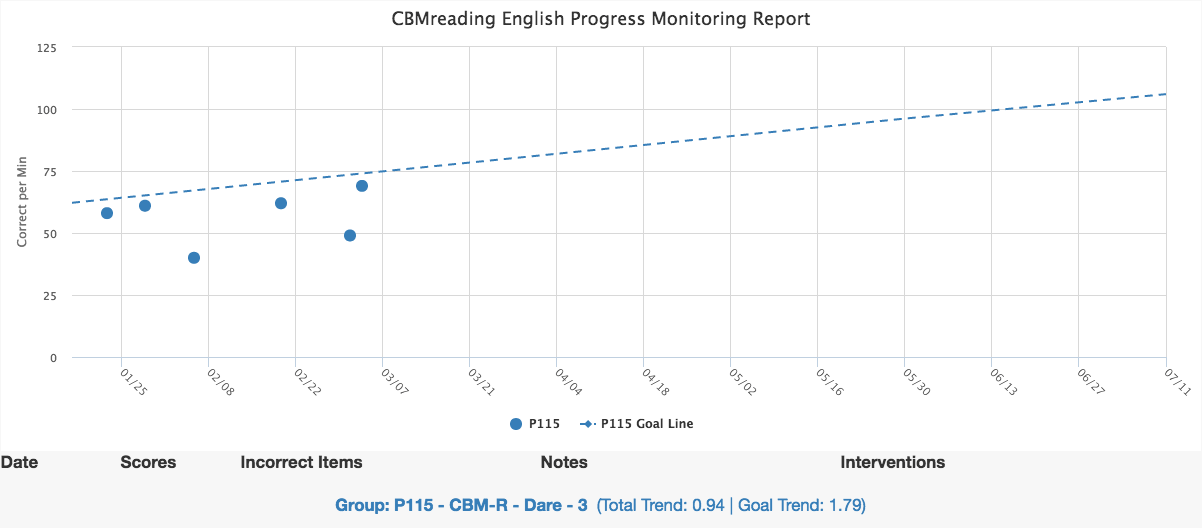
Such graphs include the data points for each progress interval, weekly to monthly. By examining an individual student’s graph, a teacher can learn if that student is on track to meet a specific learning goal. Such graphs are powerful tools for supporting individual students, but do not work well for learning about the overall growth of students by class, grade, or school. Instead, screening data from two or more intervals can be used to learn about group growth over time.
Group Growth
Universal or benchmark screening data initially serves to help teachers identify which students might need intervention. Screening data can also provide information about student growth, as long as there are two or more intervals of data to compare. Traditionally, such growth was examined only on the basis of students’ scores, however, recent innovations have provided additional tools to examine student growth over time. In particular, a helpful tool to learn whether students are maintaining learning growth are Student Growth Percentiles (SGP). FAST™ provides SGP data in the Norms section of the main menu. Below is the table of norms for second grade CBMreading-English.
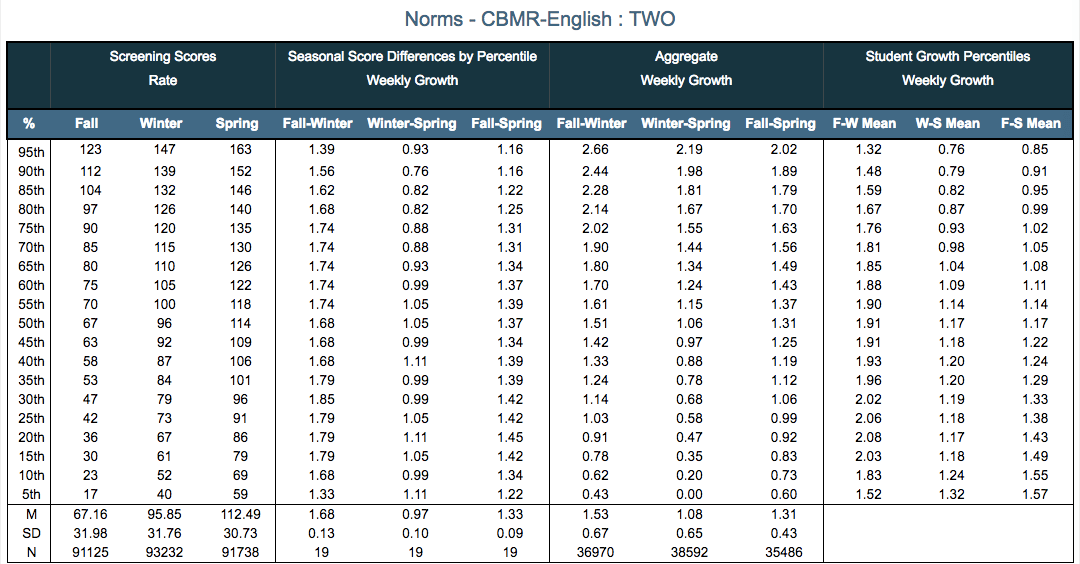
The columns on the far left show the average scores of second graders at percentiles from 5th to 95th at intervals of 5. These numbers give us an idea of what scores can be expected by students at each screening period. The middle two sets of columns show weekly growth amounts in two ways. The middle left column shows the average weekly growth made by students at each percentile ranking. The middle right column shows the average weekly growth for all students when the data is aggregated. The far right columns include the new SGP data. These columns are different because they show the percentile ranks of growth instead of actual scores. This detail can be understood by looking at the fall to winter growth numbers for students between the 5th and 50th percentile ranks. You will notice that the students who started with the lowest scores in the fall made the biggest gains from fall to winter. By comparison, the students who started out with higher scores, made gains but they were not as large. The good news is that this data shows that students who start out below grade level in the fall can, and should, make bigger gains that higher performing students.
Importantly, these tables document the growth for groups of students, not individuals. This information is very important in relation to allocating instructional resources for the purpose of improving all students’ outcomes. If a school’s data team notices that the average growth of lower performing second graders is below the norms on the above table, additional instructional resources could be put in place to improve students’ weekly gains by the end of the school year. Typically, lower performing second graders who are provided with effective reading instruction from the beginning of the year, will make bigger gains from fall to winter. But, if those students do not make such gains, and instruction is changed in the winter, they can still improve from winter to spring. We know that the earlier we help students catch up to grade level performance, the fewer resources it will take and the more likely that student is to graduate. SGP data are another tool that teachers can use to monitor group growth and focus resources where needed to improve outcomes for all students.
FastBridge Learning is currently updating its Group Growth Report to include more specific details about student growth in weekly and monthly units. These changes are designed to help school teams evaluate group-level improvements alongside the individual improvements observed in progress graphs. All such tools are designed to help educators counter the “Matthew effect” which is the phenomenon where poor readers stay poor and strong readers stay strong unless we intervene and implement different instruction so that poor readers can catch up and become strong readers too. Both individual and group growth data will help teams evaluate and make changes to instruction for the benefit of all students.
Dr. Rachel Brown is FastBridge Learning’s Senior Academic Officer. She previously served as Associate Professor of Educational Psychology at the University of Southern Maine. Her research focuses on effective academic assessment and intervention, including multi-tier systems of support, and she has authored several books on Response to Intervention and MTSS.
![[eBook] Get the Whole Picture: Using Social, Emotional and Behavioral Assessments to Support Student Success](https://5196620.fs1.hubspotusercontent-na1.net/hubfs/5196620/AdobeStock_157265506.jpeg)