By: Rachel Brown, Ph.D., NCSP
During the 2016–17 school year, FastBridge Learning has updated a number of the reports available in FAST™. A new report, in Lab phase this year, is the Screening to Intervention (s2i) Report. This report is unique in that it provides teachers with detailed guidance about what interventions a student is likely to need based on FAST™ screening scores. The s2i Report is available for reading and math and uses scores from multiple FAST™ measures to identify possible interventions for students.
S2i Report: Data Sources
The s2i Report pulls data from multiple FAST™ measures. The reason for using more than one source of information to identify students who need intervention is a well-established practice in schools using a multi-tiered system of supports (MTSS) for all students. Having more than one source of information about a student’s school performance is important because it ensures that decisions are based on accurate information. All forms of assessment include some amount of error. Such errors can result from factors like the student’s effort on the day of the test, the testing conditions (i.e., too hot or too cold), or teacher mistakes when administering the measure. In order to be sure that any given student score is accurate it must be compared to some other source of information about a student’s skills and performance. One way to do this is to have the student’s teacher look at universal screening scores for all of his or her students and confirm whether they are accurate as compared to how the student is doing in the classroom. This teacher-comparison method is likely to be accurate, but it could be time consuming.
Another way to have multiple sources of information about students skills is to have the students complete multiple assessments that measure the same or similar skills. Collecting multiple sources of information about student performance is a regular (even daily) school activity. Examples include quizzes, tests, writing samples, and teacher observations of the students during instruction. While all of these are valid sources of information about each student’s skills, they are not all going to provide scores or other data that can easily be compared. For example, a chapter quiz might have one type of score and a writing assignment another. For this reason, FastBridge developed the s2i Report. This report automatically pulls students’ scores from two key assessments and uses the combined information to generate suggestions about instruction, intervention, and progress monitoring. In this way, the s2i Report is a form of multi-method, multi-informant data collection. The s2i Report for reading is available for students in grades K–12, and for math, grades K–8.
s2i Report for Reading. The s2i Report for reading uses data from the aReading, earlyReading or CBMreading and AUTOreading measures in FAST™. The selection of either earlyReading-Letter Sounds (K) or CBMreading (1-12) is based on the student’s grade level. These are the generally accepted measures for students in these grade levels. In cases where students have completed the AUTOreading measures instead of earlyReading or CBMreading, those scores are used. Altogether, it is estimated that most students will need about 30 minutes to complete the combination of tests for their grade level. These specific FAST tools were selected for the s2i Report because of the type of information they provide. aReading is a broad measure of a student’s overall reading skills and includes items covering all five of the areas documented in the National Reading Panel report (2000): (a) phonemic awareness, (b) phonics, (c) fluency, (d) vocabulary, and (e) comprehension. The earlyReading, CBMreading, and AUTOreading tools measure narrower strands of a student’s reading skills, and provide more detailed information about how a student’s current performance compares with peers, either locally or nationally.
s2i Report for Math. In similar fashion, the s2i Report for math pulls scores from the aMath and selected earlyMath subtests (K-1) or CBMmath Automaticity and Process (2-8) assessments, using measures that represent the most commonly taught content for each grade level. Like the reading version, this report compares each student’s scores on the selected measures and indicates which students might benefit from intervention in what mathematics skill areas. The aMath assessment includes items representing a broad spectrum of all math skills, including the core skill areas included in the Common Core State Standards. These areas are: (a) counting and cardinality, (b) operations and algebraic thinking, (c) number and operations in base ten, (d) number and operations – fractions, (e) measurement and data, and (f) geometry. As for reading, the earlyMath and CBMmath measures indicate a student’s performance on a narrower range of specific math skills.
Using the s2i Reports for reading and math provides two main benefits for teachers. First, these reports automatically compare student performance on multiple measures and provide information about the general reliability of each score. Importantly, these reports display the students’ scores side-by-side so that teachers can quickly view them in one place. The second benefit of the s2i report is that it can provide detailed suggestions about what type of instruction or intervention and progress monitoring each student needs. Such recommendations are an optional feature of the report and are based on the specific intervention tools and are available in the school or district. In order to use the intervention feature, the FAST™ district or school manager needs to enter the names of those interventions available locally.
S2i Report: Layout
Below are screenshots of both the reading and math s2i Reports. Under each picture is a detailed list of all of the features in each report.
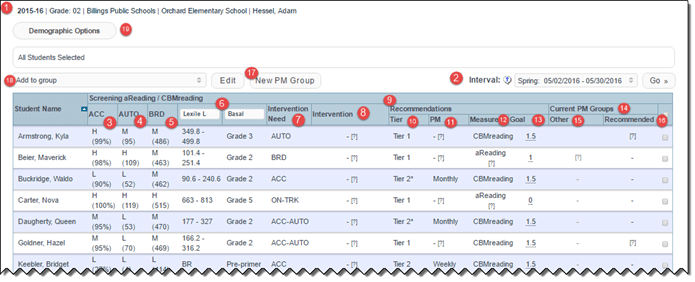
Screening to Intervention (s2i) Report for Reading
Screening to Intervention (s2i) Report for Math
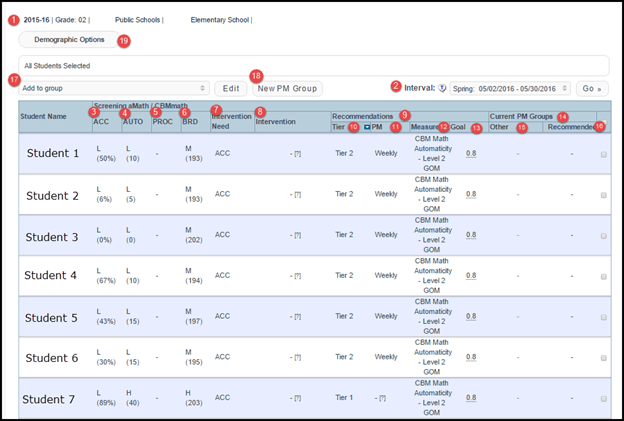
- School, grade, class information
- Screening period
- Accuracy rating (ACC):
- Reading:
- earlyReading for grades K-1, or from
- CBMreading or AUTOreading score for grades 2-8
- Math:
- .earlyMath for grades K-1, or from
- CBMmath Automaticity score for grades 2-3
- Automaticity rating (AUTO) -
- . Reading:
- .Composite score in earlyReading for grades K-1, or from
- CBMreading or AUTOreading score for grades 2-8
- Math:
- .Composite score in earlyMath for grades K-1, or from
- CBMmath Automaticity score for grades 2-3
- Reading: Broad rating (BRD) - aReading score
Math: Process (PROC) - CBMmath Process score
- Reading: Score comparisons (based on aReading performance) available for other reading indications (i.e. Lexile, Basal, F&P etc.)
Math: Broad rating (BRD) - aMath score
- Recommended intervention area: ACC, AUTO or BRD. ON-TRK indicates the student is on-track for performance at grade level.
- Suggested intervention (this list will have information only if set up in advance)
- Recommendations for Progress Monitoring:
- Tier Level - Based on local norms, this suggests the tier at which interventions may be most appropriate. NOTE: FAST does not offer a Tier 3 assignment as that is decided by the district on a student by student basis.
- Tier 1 (equal to or above the 30th percentile) suggest school or district wide support may be appropriate.
- Tier 1+ (below the 30th percentile, but equal to or above the 20th percentile) suggests individual support desired, if resources allow, but school or district wide support is also appropriate.
- Tier 2 (below the 20th percentile) individual support is recommended.
- Frequency: Suggested frequency for progress monitoring based on Tier assignment
- Measure: Suggested progress monitoring measure based on skill level
- Goal: Suggested weekly score gain needed by the student in order to reach the end of year benchmark
- Existing progress monitoring groups
- The student’s current progress monitoring group (if any). Clicking on the name of the PM Group will take you to that group’s FAST™ page.
- Recommended progress monitoring group to use for continual progress monitoring
17 -19. Additional features to add students to groups or view the data differently
The bottom of each s2i Report has more information on the types of interventions and the basis for recommending interventions for each student. Exactly what information will be included in each s2i Report depends on the grade level of the students included. The example below shows the information for s2i Math for third graders. Note that the report uses percentile rankings for students below grade level in order to identify what type of instruction or intervention each student needs.
Bottom of s2i Report
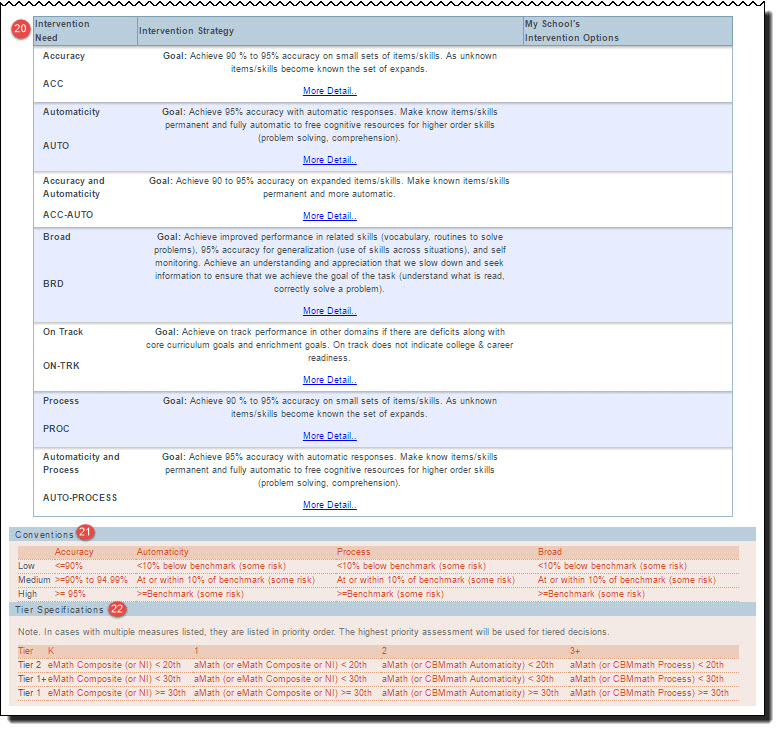
- Descriptions: each type of skill area for accuracy, automaticity, broad skills, combinations, and on-track.
- Conventions: Low, Medium, and High score indicators for each skill area based on percentile rankings (these are set up by each district)
- Specifications: Tier suggestions according to the Low, Medium and High ratings for each grade level
s2i Report: Next Steps
The s2i Report is designed to help teachers select and use the most effective instruction and interventions for students across multiple tiers of support. There are three “Tier” level indicators used in the s2i reports: (a) Tier 1, (b) Tier 1+, and (c) Tier 2. Tier 1 indicates students who are on track to meet end of year learning goals (e.g., benchmarks) with the core instruction provided in the general education classroom. Tier 1+ indicates students who would most likely benefit from focused and differentiated support in the general classroom during core instruction. For example, Tier 1+ could be used to identify students who can be grouped together for daily small-group direct instruction and practice with the classroom teacher during the core instruction block. Tier 2 indicates students who most likely need additional instructional time beyond that which is provided during core instruction. Such students will benefit from daily intervention lessons of about 30 minutes each that focus on the specific area of need shown on the s2i Report. The s2i Report does not have a Tier 3 designation because Tier 3 intervention is typically associated with very intensive intervention for students who are substantially below grade level. Identifying and supporting students who need intensive intervention requires planning and implementation that can be done only at the local school level by grade or building level teams.
During the 2016–17 school year the Screening to Intervention Report is in Lab and current FAST™ users might not currently be screening all their students with the two measures required to generate a completed s2i Report. During the Lab phase of any FAST™ tool, we welcome feedback from customers about how it is working and what changes might be helpful. In order to “try out” the s2i Report this year, school teams could use it with those students who demonstrate some risk on another FAST™ report. For example, if your school screens all students with aReading, the Group Screening Report will show which students might be at some or high risk of reading problems. It is possible to conduct a secondary screening of just those students who are at some level of risk according to aReading by using earlyReading-Letter Sounds, CBMreading, or AUTOreading measures, depending on grade level. With the additional data from a secondary screener, the s2i Report will show what type of intervention, if any, is recommended for each of these students. If the school or district manager sets up the Intervention tool in FAST™, the s2i Report will also list a specific, locally available intervention that could be used with each student.
Summary
The s2i Report is a new FAST™ tool in Lab stage during the 2016–17 school year. This report provides teachers with an efficient way to collect multiple sources of information on similar but different types of measures of reading and math--combining the unique benefits of adaptive and CBM measurement. When the required screening assessments have been conducted, the report will provide information about each student’s accuracy, automaticity, broad, and (in the case of math) procedural skills. The s2i Report uses these data to identify what specific type of instruction students at risk for academic problems need and what progress measure and group would be best for each student. The s2i Report is not designed to replace teacher expertise in the problem-solving process. Instead, it offers an additional tool that teams can use to determine which students need what help and how to monitor student progress. FastBridge welcomes feedback on the s2i Report during the 2016–17 school year so that it can be improved for the future and revisions based on user feedback are expected for the 2017-2018 school year. To submit feedback, please send an email to help@fastbridge.org
Dr. Rachel Brown is FastBridge Learning’s Senior Academic Officer. She previously served as Associate Professor of Educational Psychology at the University of Southern Maine. Her research focuses on effective academic assessment and intervention, including multi-tier systems of support, and she has authored several books on Response to Intervention and MTSS.


![[eBook] Get the Whole Picture: Using Social, Emotional and Behavioral Assessments to Support Student Success](https://5196620.fs1.hubspotusercontent-na1.net/hubfs/5196620/AdobeStock_157265506.jpeg)