By: Rachel Brown, Ph.D., NCSP
In May 2017 FastBridge released enhancements to the Group Screening Report and the Group Growth Report. These changes are designed to make the reports easier for users to understand. The enhancements included improved color coding, infographics, and attention to what types of questions specific reports are designed to answer.
Color Coding
During the 2016-17 school year, the FAST system began introducing different color coding in reports, specifically to create separate color coding for benchmarks and norms. Benchmarks are criterion-based score levels that indicate a student’s risk of not meeting end-of-year learning goals. Norms are tables, arranged by percentile ranks, of the average scores obtained by students in each grade level. Benchmarks and norms are designed to provide different types of information about student performance. Benchmarks show which students are at risk and norms provide information about how to allocate resources in relation to supporting all students.
The updated benchmark colors are pink and purple, while the norms remain in primary colors. Here are pictures of each color scheme with descriptors.
Benchmarks:![]()
Norms:![]()
Both the benchmark and norm codes have four levels each. The new color coding has been incorporated into the recently updated Group Screening and Group Growth Reports. Both of these reports have the option to toggle displays of the data between either the benchmark or norms color coding. In addition, the Group Screening Report incorporates both color schemes by showing the actual scores in benchmark colors alongside class, grade, district, and national norms.
Using FAST Reports to Answer the Right Question
All FAST reports are designed to answer one or more specific questions about student learning needs. Two important questions that can be addressed by the reports are:
- What percentage of students are meeting benchmark learning goals at each grade level?
- Which students require additional intervention in order to meet benchmark learning goals?
Usually question 1 (percentages of students meeting goals) needs to be answered before question 2 (which students need additional help). The Group Screening Report is designed to answer question 1 and the Group Growth Report is designed to answer question 2. Recent enhancements to these reports are designed to make it easier for teachers to identify the answers to these questions.
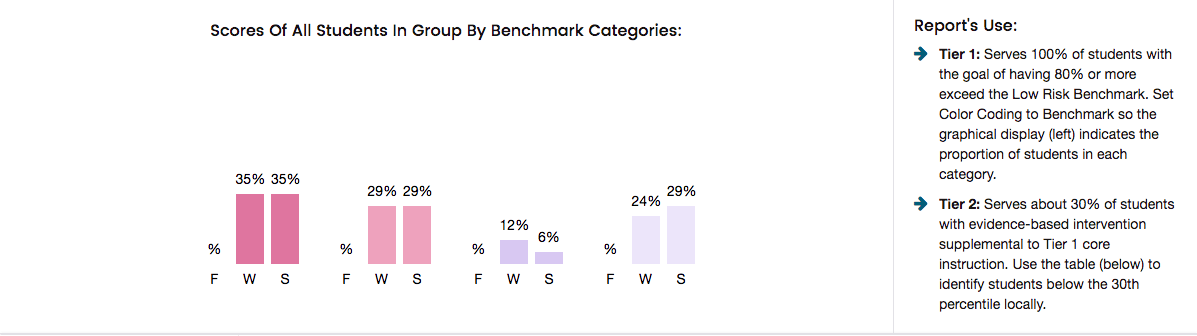
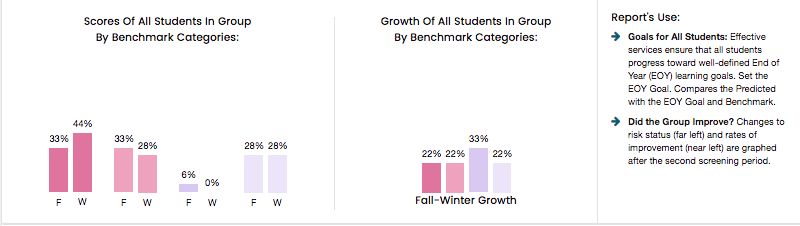
Group Screening Report. This report includes the actual scores for all students in a class or grade on both prior and the most recent screening assessment. The top part of the report shows a new infographic that summarizes the data in the report. Below is a sample of the benchmark version of the infographic for a struggling class of second graders who took CBMreading.
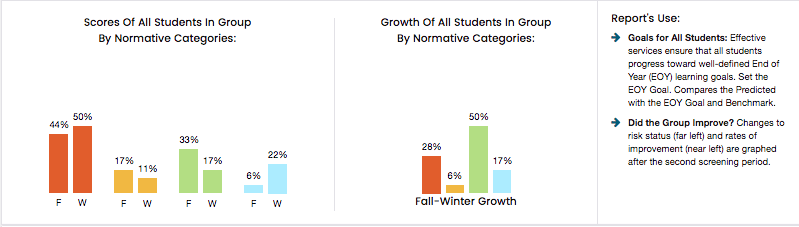
Below is the norms view infographic of the same class.
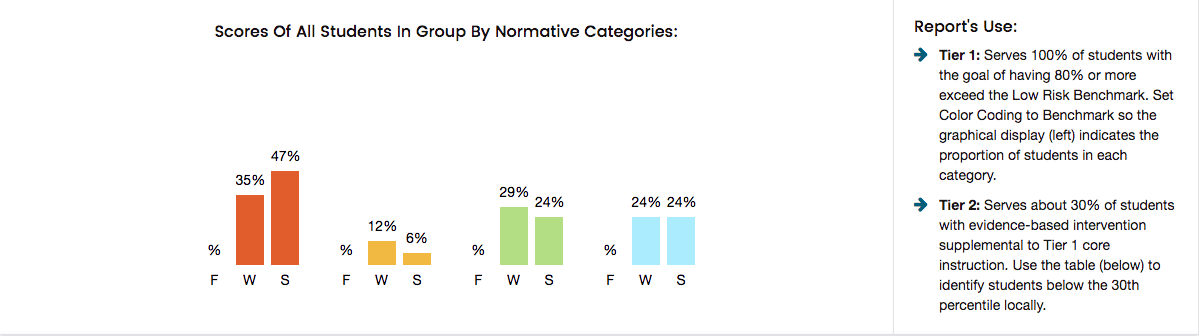
The benchmark view shows that the percentages of students at different risk levels changed very little from winter to spring. The norms view shows that the scores fell in lower percentile ranks from winter to spring. Below is the full report listing of scores that shows the risk level of each score and the different norms.
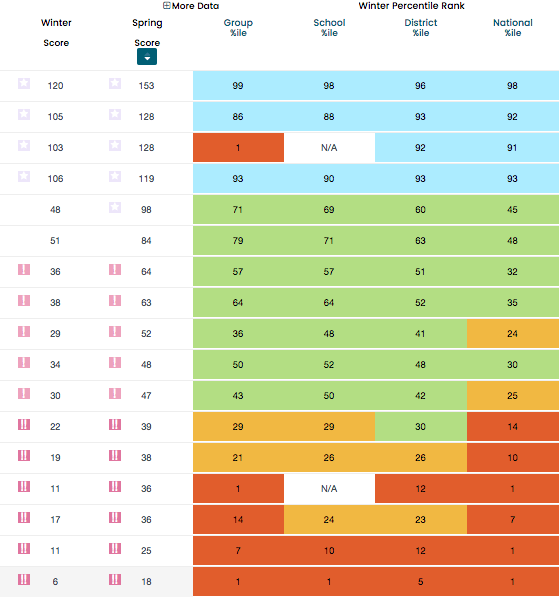
This report clearly shows that many students are at some or high risk of not meeting the end of year benchmark goal. The distribution of scores indicates that most of the students at risk have urgent learning needs. With the Group Screening Report we can answer the question what percentage of students have met the benchmark learning goal (48%). Now we can address the question of which students need what kind of help. Remember that in order for tiered supports to be effective, 80% or more of students need to meet learning goals through Tier 1 core instruction.
Group Growth Report. The classroom level version of this report is designed to show how much growth each student has made and whether that growth is strong enough to meet future goals. This report also has an infographic that can be set to either a benchmark or norms view. Here is the benchmark growth view for a second grade class.
The added information in this report is in the right hand infographic which shows the percentages of students in relation to the amount of reading growth they made. Here is the norms view of the growth infographic:
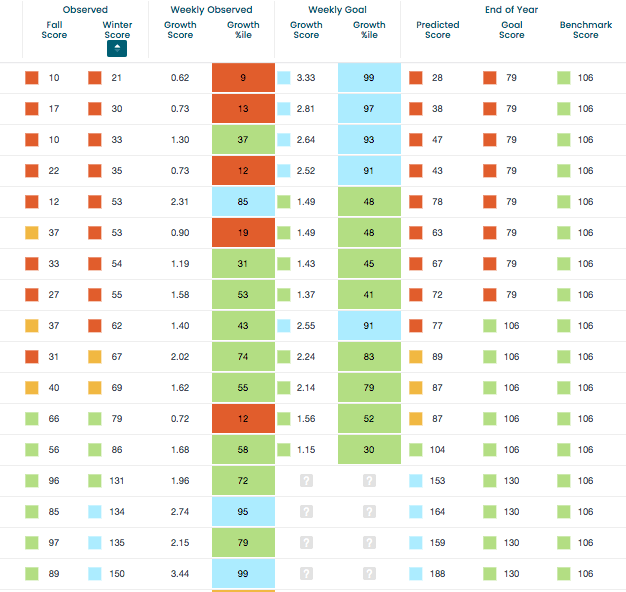
The full Group Growth Report below shows the students’ fall and winter scores, as well as each student’s predicted spring score based on fall to winter growth, a personal goal and benchmark.
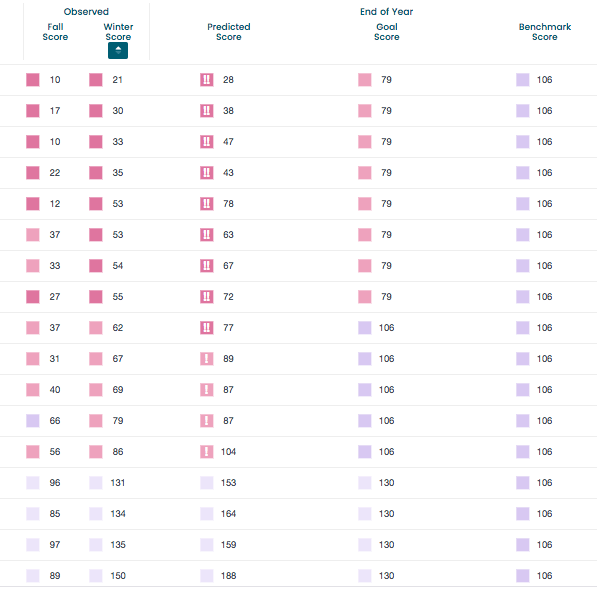
An expanded view of the above report adds observed and predicted growth amounts and percentile ranks for each student. The following view, shown with norms colors, indicates which students are growing at a rate to meet their own goal and/or the end of year benchmark, and which ones will need different instruction in order to meet the learning goal. There are also school and district versions of the Group Growth Report that show either all the grades in a school, or all the schools in a district. These versions can be used to evaluate overall program effectiveness. Such program evaluation is an important part of implementing and sustaining a Multi-Tiered System of Support (MTSS).
Summary
The May 2017 enhancements to the Group Screening and Group Growth Reports provide additional features that educators can use to identify what percentages of students are meeting learning goals in each class and grade, as well as which students need more intensive intervention in order to “close the gap” and catch up to peers. With the many options available on these reports, users are encouraged to try them out with the default settings first and then adjust details as they become more familiar with the features. More information about these report enhancements can be found in the FastBridge Knowledge Base.
Dr. Rachel Brown is FastBridge Learning’s Senior Academic Officer. She previously served as Associate Professor of Educational Psychology at the University of Southern Maine. Her research focuses on effective academic assessment and intervention, including multi-tier systems of support, and she has authored several books on Response to Intervention and MTSS.


![[eBook] Get the Whole Picture: Using Social, Emotional and Behavioral Assessments to Support Student Success](https://5196620.fs1.hubspotusercontent-na1.net/hubfs/5196620/AdobeStock_157265506.jpeg)