As the school year winds down, many school leaders will be reviewing data and setting goals for the following year. In particular, school leaders want to know if all students made at least one year’s growth in one year’s time. Additionally, for students who started out behind, leaders need to know whether they made “catch up” growth so they can meet grade level learning goals.
In order to make sense of student growth data, leaders need to know what constitutes typical growth, how it is measured, and how much additional growth some students need to make in order to reach learning goals and standards.
What Is Typical Student Growth?
For every year that students spend in school, they should acquire new knowledge and skills. The specific knowledge and skills to be learned vary by grade level but are articulated in the learning standards adopted in each U.S. state. In recent years, many states have adopted the Common Core State Standards, or revised their own state-specific standards.
The attention to these standards has made it easier for educators, parents, and policy-makers to examine typical student learning growth. Education researcher John Hattie and his colleagues conducted a comprehensive review of student learning outcomes and identified both how much growth is typical and what types of teaching activities optimize student learning.
Their work was summarized in the book Visible Learning and showed that a certain amount of student learning happens regardless of the teaching practices used, but that additional growth is observed when certain practices are employed.
Hattie’s work contributed two key ideas for educators:
- Student learning can be measured in reliable ways, and
- Some teaching practices are better than others for improving student learning.
How is Student Learning Growth Measured?
Hattie’s team used a statistical method called meta-analysis to review and compare as many studies of student learning outcomes as they could find.
Meta-analysis uses a statistic called the effect size to show how much change was observed in an experimental group as compared to a control group. While such techniques are important for advancing education research, they are not necessarily appropriate or available for teachers and principals. Nonetheless, there are other indicators that educators can use to measure student learning growth.
An important contribution to growth measurement is a calculation known as the rate of improvement (ROI). This number can be calculated from any two or more scores that used the same measurement tool.
Formative Assessment
In order to compute an ROI, students must complete two or more assessments in a specific time frame. When multiple forms of the same assessment are used within a school year, it is called formative assessment.
Formative assessment provides teachers with multiple indicators of student learning progress during the school year. It is often compared to summative assessment which involves having students complete only one assessment at the end of a school year.
The problem with summative assessment is that by the time the teachers get the students’ scores the school year is over and there is no time to help the student improve. For this reason, formative assessment has been widely adopted in many schools in recent years, often through the use of universal benchmark screening and progress monitoring.
Calculating ROI
With two or more student scores in hand, individual rates of improvement can be calculated. For example, if a second grader had a score of 47 on CBMreading at the fall benchmark screening, and then a score of 78 in the winter, that student’s ROI can be calculated by subtracting the fall score from the winter score and dividing the result by the number of weeks that passed between the two screenings.
For example:
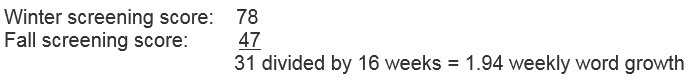
ROI can be calculated in different intervals, the most common are weekly and monthly.
Evaluating ROI
When the ROI data for individual students are grouped together, educators can learn the average, or typical, ROI for all the students in a class, grade, school, or district.
FastBridge Learning offers several ways for educators to examine the ROI data for their students, including growth data in the norms tables and in the Group Growth Report. FastBridge includes three types of ROI data in the norms tables.
Here are the norms for second grade CBMreading:
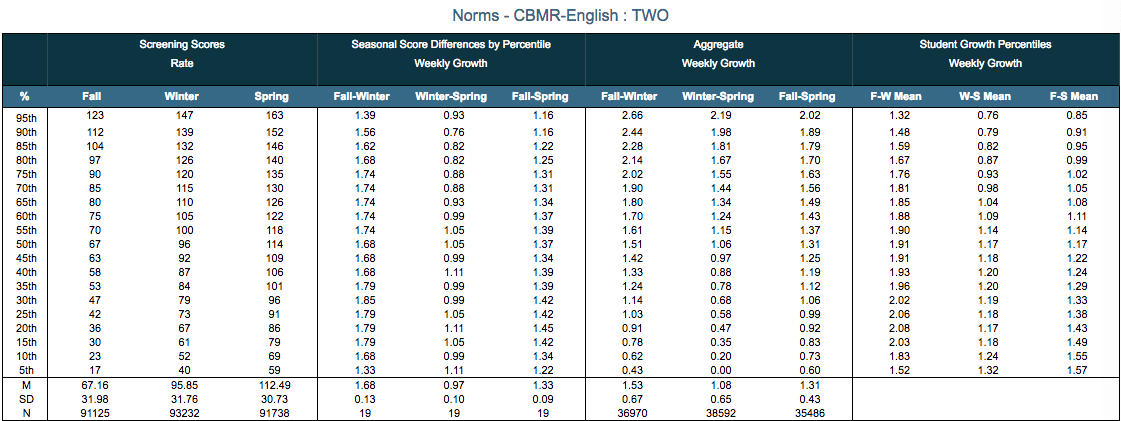
The three ROI options included are:
-
Seasonal Score Differences by Percentile
Reports the growth in the norm groups at each percentile. For example, the difference between the 50th percentile score in the fall (67) and the 50th percentile score in the winter (96) was 29. That difference corresponds to a weekly growth rate of 1.69 -
Aggregate Weekly Growth
Ranks the raw growth rates by percentiles from least (5th) to most growth (95th). These show the spread of growth rates across all students in a given grade. -
Student Growth Percentiles
Reports the average (50th percentile) of growth among students with similar prior scores. This ROI shows how much gain is typical for students who start at the same level.
By reviewing the Aggregate Weekly Growth educators can learn the range of typical growth for a grade level in a given learning area. This can be compared with the typical growth for students who start at different levels in the Student Growth Percentiles. Students who start at lower scores will need to have more growth in a year in order to catch up to peers and meet learning goals.
An additional resource educators can use to make sense of student growth is the Group Growth Report. This report can be run at the class, grade, school and district levels. Below is a sample second grade classroom level report for CBMreading.

The top part of this report includes two bar graphs. The one on the left shows the percentages of students who made four different levels of growth, ranging from flat to aggressive according to the following color codes. In the class shown above, most students had flat growth.

The next part of the group growth report shows each student’s score in the fall and winter followed by the weekly amount of actual growth, a growth goal, an end-of-year goal, and a predicted spring score based on fall to winter growth. When reviewing data after spring screening, school leaders can see whether students met their goals.

There are many options for what information is shown on this report. In this case, the scores shown are from the fall and winter screening periods. The bar graphs at the top show the percentages of students by normative group as well as percentages of gains for each group.
Within the report, the students’ fall and winter scores are shown and these scores are used to calculate the observed ROI for each student from fall to winter. The observed ROI is next to columns that show what the goal for each student was and the percentile rank of the goal.
Finally, each student’s predicted and goal scores for the spring screening are shown next to the end of year benchmark for the grade. Together, these data show information about each student’s actual ROI for the first half of the school year as well as predictions for the rest of the school year. With these data, educators can then compare the predicted growth with actual growth after spring screening to learn how much actually occurred.
How Can Students Needing Additional Growth be Supported?
For those students whose predicted score indicates insufficient growth to meet a specific learning goal, changes to instruction and intervention are often needed. When considering such changes, it is important to examine how many students in each class, grade, school, and the district are on track to meet end of year learning goals and how many are not.
When the number of students expected to fall short of the goal is low, the focus should be on providing individual supports for those students. When the number of students not likely to meet the goal is high, the focus needs to be on core instruction.
Guidance from research about implementing a multi-tiered system of support (MTSS) indicates that Tier 1 core instruction is the most important and effective way to meet the learning needs of all students (Brown-Chidsey & Bickford, 2016). This research indicates that effective Tier 1 core instruction can result in 80% or more of all students meeting end of year learning goals. When less than 80% of students are on track, as revealed through student growth data, changes to core instruction are the best way to improve outcomes for most students.
Conclusion
Student growth data provides important information about expected and observed student learning growth over time. Such information comes from formative assessments that include multiple measures of student learning. Through calculations such as the ROI, educators can see which individual students and groups are on track to reach end of year goals, and which ones are not. When the percentage of students on track is less than 80%, adjustments to Tier 1 core instruction are the most effective way to improve overall learning outcomes.
References
Brown-Chidsey, R., & Bickford, R. (2016). Practical Handbook of Multi-Tiered Systems of Support: Building Academic and Behavioral Success in Schools. New York: Guilford Press.
Hattie, J. (2009). Visible Learning: A Synthesis of Over 800 Meta-Analyses Relating to Achievement. New York: Routledge..