Universal screening has become a common practice in many schools. This screening involves having all of the students in each grade complete the same assessment. Traditional approaches to universal screening have typically included conducting the assessments three times a year, in the fall, winter and spring. However, research about screening indicates that perhaps it is not necessary to screen all students three times a year, and less frequent screenings can provide enough data about student performance to guide instruction.
This blog will review the purposes of universal screening, explore recent research findings and provide suggestions for alternative screening schedules. A primary focus will be on how to use spring screening data to group students for fall instruction so that those students needing interventions can access them at the very beginning of the new school year.
What Is the Purpose of Universal Screening?
There are two main purposes for universal screening: (a) program evaluation, and (b) identifying students needing assistance.
Program Evaluation
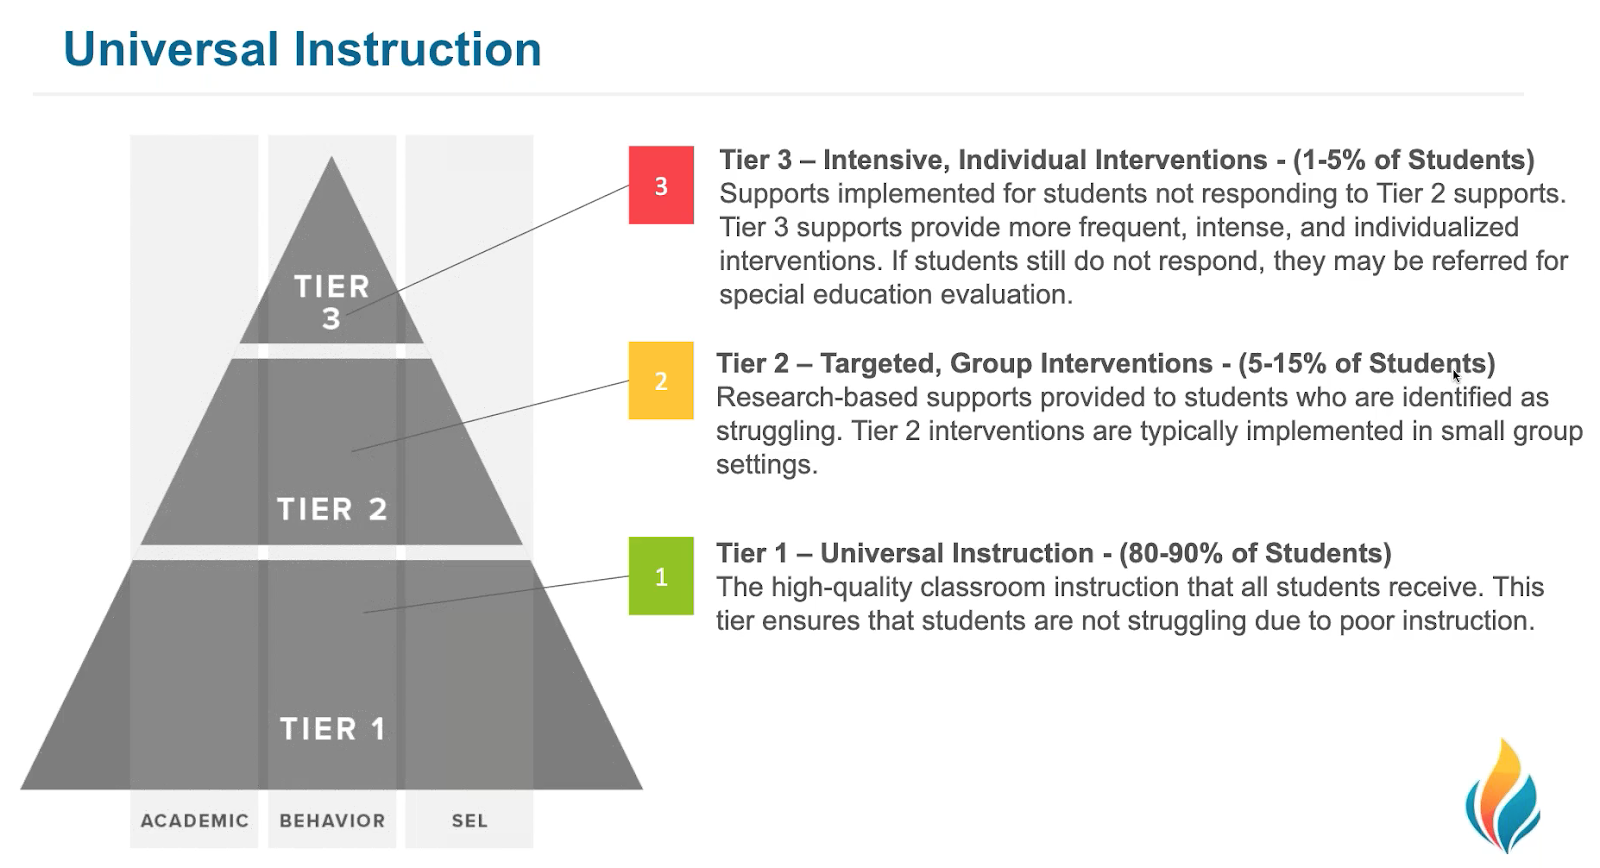
Screening data can be used to show the effects of Tier 1 core instructional programs. Examining the effects of core instruction is an important part of a Multi-Tiered System of Support (MTSS). Only when core instruction is effective will other supports be helpful. Core instruction is typically considered effective when 80% or more of students attain the grade-level learning goal at each screening period. When this is the case, additional supports for students who need them can focus on supplementary instruction. When less than 80% of students have met the benchmark, it is important that efforts be put in place to strengthen core instruction as well as provide supplemental interventions for those students with the greatest difficulty.
Students Needing Assistance
The second purpose of universal screening is to identify which students might need extra help. Importantly, a student’s screening score must be compared with other sources of information in order to confirm that the score is accurate. Comparing multiple sources of information also helps teachers identify each student’s specific learning need.
It is likely that even when less than 80% of students have met the benchmark goal, there will be some students who are very significantly behind their peers. For such students, immediate assistance alongside ongoing efforts to improve core instruction is important.
Research on the Benefits of Universal Screening
Screening studies have documented that such data are predictive of later student performance (Eklund, Kilgus, von der Embse, Beardmore, & Tanner, 2017; Kettler & Albers, 2013). Researchers have reviewed a number of different types of screening measures, including Computer-Adaptive Tests (CAT), Curriculum-Based Measures (CBM) and rating scales (Glove & Albers, 2007; Kettler & Elliott, 2010; Salinger, 2016).Other research has examined the frequency of universal screening and indicated that less frequent screening for some students is just as effective but with less interruption to instruction (Klingbeil, Nelson, & Van Norman, 2017; Stevenson, 2017; Van Norman, Nelson, Klingbeil, 2017; VanDerHeyden, 2013).
Based on these findings, it appears that using spring data to group students for the following school year, based on their individual learning needs, is one way to reduce testing time while increasing intervention access at the beginning of the school year.
Identifying the Right Screening Schedule
There are pros and cons to screening all students three times a year (tri-annually). Benefits include:
- Ongoing universal data
- Information from the beginning and end of each school year
- Growth indicators
- More information to share with parents
Despite these benefits there are also limitations from tri-annual screening:
- Time consuming
- Takes time from instruction
- Not needed for all students
- Might not provide necessary details for intervention
Given these pros and cons associated with tri-annual screening, it is important to compare tri-annual screening with other schedules. The following table lists possible outcomes when less frequent screening is conducted:

Although each screening schedule has some benefits and drawbacks, the one that can help to ensure that students start intervention immediately when the school year begins is the winter and spring schedule. With this schedule, the school does not conduct a fall screening of all students but, instead, uses the prior year’s spring data to group most students for instruction. Both teacher assignments and small group intervention plans can be made using a combination of the spring data and other records for returning students. As explained below, fall screening can still be conducted for any new students so that teachers will have data to inform the best instructional placements.
Planning for Fall Exceptions
Using spring data is likely to work for most, but not all, because some students will move over the summer. For this reason, it is important to have a screening procedure for new students.One method is to have the student complete the screening assessment at the time of enrollment. For example, the student could complete the screening activities while the parent fills out enrollment forms.
Another group of students for whom the winter and spring schedule might not work is kindergarten. This is because this is the very first school level and kindergarten students will not have spring data from the previous year. Depending on whether your district’s kindergarten program is mandatory, it might be helpful to gather fall screening data from first graders as well.
In general, the longer that students have been in school, the more data are available regarding their school progress. For this reason, using a screening schedule that includes conducting less screenings as students move to higher grades could be effective. The following table provides suggested screening frequencies by grade levels.

For all grades, except at the beginning of kindergarten, the prior year’s spring data can be used as part of the process of grouping students for the following year. For kindergarten and first grade students, the fall assessment can take place at a screening conducted before school starts, or on the first days of school. For high school students, screening beyond ninth grade is not needed because students who are on track will generally stay on track and those who need help are generally already identified based on prior assessments and grades. Still, if a student moves into the high school with limited, or no, prior school records, an initial screening can be done to identify what classes would be most appropriate.
Examples of Using Spring Data
What would using spring data look like when using FAST™ reports? Let's review some examples.
Grade-Level Group Screening Report
Here is an example for fifth grade aReading scores. This report must be run by a specialist, school, or district manager. It provides a summary of student screening scores for each class in a specific grade.
This report can be a first step in reviewing scores and identifying needs. Notice that one of the teachers, Ms. O’Brien, had students whose scores were much higher throughout the year. The other teachers had students with more variable and lower scores. This finding could lead to a discussion about whether the instruction provided in each class was the same or different.

Class-Level Screening Reports
The fifth grade teachers could then look at the Group Screening Reports for each class to learn how many students in each class did or did not meet the benchmark goal. This information would help further the conversation about whether changes in core instruction are needed. In addition, the teachers can talk about how many students demonstrated different risk levels and what types of instruction they need. In addition to planning for next year’s core instruction, the teachers can identify which students have similar learning needs and would be able to participate in the same intervention groups.

In some cases, the teachers might already know what instruction a student needs. In other cases, they might want to examine other reports to get more details. Another FAST report that can assist teachers in learning about student needs is the Individual Skills Report.
Individual Skills Report
This report provides a breakdown of the students’ strengths and weaknesses on the screening assessment. The specific content included in the Individual Skills Report varies according to the assessment. For example, for CBMreading, this report includes the specific words that a student reads correctly and incorrectly.
Below is an example for a fifth grade student in the class shown above who took the aReading assessment. The aReading version of this report breaks down the student’s performance into the Common Core State Standard (CCSS) reading skill areas and provides a list of skills that the student has mastered, is developing, or are in the future.
The CCSS English Language Arts skill areas are:
- Foundational Skills
- Reading Literature
- Language
- Informational Reading


The above student’s aReading score and skills analysis indicate a need for significant Foundational Skills instruction. For this student, it would make sense to create a fall schedule that incorporates daily intensive foundational reading instruction as well as opportunities to practice those reading skills in decodable texts matched to the instruction.
Conclusion
FastBridge Learning® offers many resources that teachers can use to screen students in order to review program effectiveness as well as identify those needing more assistance. Research indicates that it might be possible to screen students less than three times a year and still be able to achieve both of these screening goals. Possible alternative screening schedules include screening three times a year in kindergarten and first grade but less often in higher grades. The main benefit of this adjusted screening schedule is being able to group students for fall instruction each spring so that those needing extra help can get it as soon as the school year begins. In addition, it alleviates the need for fall screening, which gives more time for instruction.
DEMO FAST
References
Eklund, K., Kilgus, S., von der Embse, N., Beardmore, M., & Tanner, N. (2016;2017;). Use of universal screening scores to predict distal academic and behavioral outcomes: A multilevel approach. Psychological Assessment, 29, 486-499. doi:10.1037/pas0000355
Glover, T. A., & Albers, C. A. (2007). Considerations for evaluating universal screening assessments. Journal of School Psychology, 45, 117-135. doi:10.1016/j.jsp.2006.05.005
Kettler, R. J., & Albers, C. A. (2013). Predictive validity of curriculum-based measurement and teacher ratings of academic achievement. Journal of School Psychology, 51, 499. doi:10.1016/j.jsp.2013.02.004
Kettler, R. J., & Elliott, S. N. (2010). A brief broadband system for screening children at risk for academic difficulties and poor achievement test performance: Validity evidence and applications to practice. Journal of Applied School Psychology, 26, 282-307. doi:10.1080/15377903.2010.518584
Klingbeil, D. A., Nelson, P. M., Van Norman, E. R., & Birr, C. (2017). Diagnostic accuracy of multivariate universal screening procedures for reading in upper elementary grades. Remedial and Special Education, 38, 308-320. doi:10.1177/0741932517697446
Salinger, R. L. (2016). Selecting universal screening measures to identify students at risk academically. Intervention in School and Clinic, 52, 77-84. doi:10.1177/1053451216636027
Stevenson, N. A. (2017). Comparing curriculum-based measures and extant datasets for universal screening in middle school reading. Assessment for Effective Intervention, 42, 195-208. doi:10.1177/1534508417690399
VanDerHeyden, A. M. (2013). Universal screening may not be for everyone: Using a threshold model as a smarter way to determine risk. School Psychology Review, 42, 402.
Van Norman, E. R., Nelson, P. M., & Klingbeil, D. A. (2016;2017;). Single measure and gated screening approaches for identifying students at-risk for academic problems: Implications for sensitivity and specificity. School Psychology Quarterly, 32, 405-413. doi:10.1037/spq0000177